Jumat, 30 November 2012

2012Q3 GDP: An Upward Revision, As Expected

We were really amused to read Ed Morrissey's lead in his take on the BEA's release of its second estimate for how much the U.S. economy grew in the third quarter of 2012:

When I wrote about the advance estimate from the Commerce Department on Q3 GDP hitting 2.0%, some commenters warned that the report — which came out just before the election — would be sharply revised after it. They were right, although the revision went in the opposite direction they suspected. The revised Q3 GDP number jumped upward to 2.7%, the best quarter of the year, although still substantially a stagnation number, especially when one sees the source of the growth

While Ed then goes on to note the role of government spending and particularly defense spending in boosting the GDP growth rate for the quarter, we really can't help wonder who the commenters who picked the wrong direction for the revision are.

Because clearly, they aren't us! Here's what we wrote nearly one month ago:

As we expected, economic growth in the United States picked up in the third quarter of 2012, increasing from the annualized growth rate of 1.3% recorded in 2012-Q2 to 2.0% in the BEA's initial GDP estimate for 2012-Q3.

We had forecast that real GDP would be recorded at $13,602.8 billion in terms of constant 2005 U.S. dollars, and the BEA's initial estimate came in at $13,616.2 billion - a difference of $13.4 billion, or within 0.01% of the BEA's recorded figure.

The BEA will revise this figure twice more before the end of the year. We anticipate that it will be adjusted upward, as the third quarter of 2012 likely recorded the U.S.' strongest economic performance for the year.

And here's what we wrote nearly a month before that:

Although we're coming off a quarter where the U.S. economy could reasonably be described as being in a "microrecession", as we had long expected, we anticipate that the GDP growth rate will be stronger in the third quarter of 2012 by comparison. Going by the dividend futures data we've had available since November 2011, the third quarter of 2012 has always looked as if it would be the strongest in 2012. Much like how the second quarter of 2008 was the strongest quarter in that year, even though the U.S. economy had already peaked and had begun falling into recession earlier in December 2007.

We'll give the next-to-final word to the Emperor:

But alas, when it came to serious analysis of data in real time, the Emperor was no Moradmin Bast. Geek out on that if you will....


Kamis, 29 November 2012

Transforming Student Loans from Taxes Back into Debt

James Pethokoukis notes the skyrocketing ratio of student loan debt to household income, the currently spiking default rate on student loans, and wonders if a new federal government bailout is in the works:

See where this is heading? When you take into account America’s burgeoning bailout culture and the rising political power of younger voters, it’s no surprise that Citigroup thinks taxpayers might end up riding to the rescue:

Taxpayers already (or will) indirectly subsidize both the housing and healthcare sectors by covering GSE losses and paying for a healthcare system that pays out more than it receives in revenues. If the continued misalignment of educational resources ultimately leads to government “forgiveness” of student loan debt, it will simply be one more example of fiscal subsidies for a narrow demographic.

Citigroup estimates that writing off defaulted student loans would cost $74 billion, though such a move might nudge other borrowers to strategically default in hopes of a bailout of their own.

We have a very easy solution for this scenario, which enterprising politicians might use to both ride to the rescue of distressed student loan borrowers while avoiding the moral hazard issue of encouraging other borrowers to strategically default on their student loans: restore the ability of distressed borrowers to have their student loan debt discharged in bankruptcy!

In one fell swoop, it would be possible to both relieve the genuine distress of the excessive debt held by these individuals in such a way that would stop other less-distressed but really opportunistic people from considering strategic defaults on their student loans, thanks to the restrictions and higher costs of future borrowing activity that would be placed upon them in bankruptcy proceedings.

Plus, this reform would have the unique benefit of forcing the undoing of one of the biggest political power grabs of recent years: the federal government's takeover of the student loan industry.

Here, the unspoken goal of President Obama's policy has been to fully exploit the restriction of borrowers from being able to discharge their student loan debts in bankruptcy court as a backdoor means by which he could increase the amount of money that the federal government collects from low and middle income earners. All, we might add, without having to go through the hassle of fighting the political battle that would come from attempting to directly increase their income tax rates.

Just in case you wondered why President Obama has always been so keen to push "cheap" student loans....

That's also why President Obama has been so focused on increasing the tax rates of just those with high incomes, while pushing to keep the Bush-era tax cuts in place for low and middle income earners, even though such a strategy will do very little to reduce the federal government's annual budget deficits or the national debt. Since most income in the United States is actually generated by people who earn much less than $200,000 (or $250,000 per household), the President is simply using the old deceptive magician's trick of distraction in an attempt to keep low and middle class earners from recognizing how much of their income they're really paying in total to the federal government.

It doesn't matter that it's called "debt". If you cannot discharge it in bankruptcy and you owe it to the federal government, which sets the size of your payments according to the amount of your annual income, then the money that you're paying to the government should more properly be called "taxes".

At the very least, the federal government should require student loan borrowers to write that number somewhere in the "taxes you paid" section of their tax returns....

Image Source: ZeroHedge.

Rabu, 28 November 2012

2012's Worst Paying College Degrees

Payscale.com analyzed the data in its online salary database and has revealed the college degrees that go along with the jobs that have the lowest median pay for their respective career professionals in its 2012-13 College Salary Report. Note - these figures represent the typical annual combination of pay, bonuses, commissions and profit sharing earned by people who have been successful in working in these fields for at least 10 years and were willing to participate in Payscale.com's survey, which means the reported median incomes will likely be inflated above each field's actual median incomes....


College DegreeMedian Annual Salary
Child and Family Studies$37,700
Social Work$45,300
Elementary Education$46,000
Human Development$47,800
Special Education$48,900
Culinary Arts$49,700
Athletic Training$49,800

So what possesses people to take out big student loans to go into professions like these that offer such little compensation? Payscale.com offers the following insight:

"According to our research, people in these majors typically believe their work makes the world a better place," says PayScale’s lead analyst Katie Bardaro.

Another Graduate Goes Begging for a Job - Source: GlobalElites

To translate, the people in these majors are perhaps so disconnected from reality that they do not recognize that the reason their trades provide so little return on their educational investment is because they really do not require unique ability, which is why society does not reward them with greater compensation.

These people are then exploited by the higher education establishment, which really does know better, but can't help noticing that these same people are willing to pay nearly the same amount of money for their college degrees as do people in careers that society values a lot more.

And let's not forget the role of the U.S. federal government in guaranteeing and issuing student loans, which has its own ulterior motives for pushing higher education that offers little real benefit to society.

Elsewhere on the Web

Say what you will about the careers that go with the degrees above, but at least many of the people who pursue these degrees might actually get jobs in their fields of study, if only low paying ones. Kiplinger's Caitlin Dewey takes things several steps further and identifies the college degrees in Payscale.com's database that combine low pay with high rates of unemployment for their graduates!

Also, this isn't just an American phenomenon. Don't miss this perspective by a recent PhD graduate in Britain who complains that the "real world" doesn't understand or appreciate their skills.

Image Source: Global Elites.

Selasa, 27 November 2012

Factoring in the Falling Dollar for US-China Trade

In a article, we indicated that the U.S. Census' data on the value of U.S.-China international trade was overstating the growth in the value of that trade because of the falling value of the U.S. dollar with respect to China's currency, the renminbi (or as its often referred to in foreign exchange, the yuan):

Here, we see that the growth of China's exports to the United States is continuing its trend of slow growth, while following its typical seasonal pattern. Typically, China's exports to the U.S. peak each year in the period from August to October, in advance of the U.S.' holiday shopping season.

In reality, because the value of the U.S. dollar has been falling with respect to the value of China's currency since early 2010, the value of trade shown in the chart above represents a lower quantity of actual goods and services traded today than what similar values in 2010 would indicate.

Today we're going to show that's exactly the case. In our first chart, we're showing the value of goods and services imported by the United States from China priced in both U.S. dollars, as reported by the U.S. Census, and priced in Chinese yuan, going by the official exchange rate recorded by the U.S. Federal Reserve.

Value of U.S. Imports from China, January 1985 - Present

In the chart, we've tweaked the vertical scale for the Chinese yuan so that it corresponds to that currency's minimum value with respect to the U.S. dollar from January 1994, when the value of the yuan was set to be worth just 11.46 cents (or 0.1146 U.S. dollars). As of October 2012, the relative value of the dollar has fallen so that one yuan is now worth 15.96 cents (or 0.1596 U.S. dollars).

With that visual adjustment made, we discover that from the Chinese perspective, there has been almost no increase in the value of China's exports to the United States since 2010, and very little growth since 2007.

Our second chart shows how U.S. exports to China have fared in terms of both U.S. dollars and Chinese yuan:

Value of U.S. Exports to China, January 1985 - Present

Measured in terms of China's currency, we find that the value of U.S. exports to China has actually been declining since they peaked in January 2010, which coincides with the peak of that nation's economic stimulus spending, which it had earlier specified on 6 March 2009. (The announcement of how the Chinese government would implement its massive stimulus program is the economic event that finally arrested and reversed the steep decline of the U.S. stock market at the time following the U.S. fiscal crisis of 2008.)

Our final chart shows the year-over-year growth rates for the U.S. imports from China calculated in terms of the U.S. dollar-based data and for U.S. exports to China calculated in terms of Chinese yuan-based figures, since these units are how each nation's economy would actually see the value of trade imported from the other nation:

Year Over Year Growth Rate of U.S.-China Trade, January 1986 - Present

Through September 2012, we find the year-over-year growth rate of trade between the two nations is at near-zero levels of growth, indicating near recessionary conditions if we take this measure as an indication of the relative health of the economies of both nations. But perhaps the real news is what factoring in the falling dollar does for our impression of the health of China's economy.

Previously, using just the U.S. dollar-based growth rate of U.S. exports to China, we found that China's economy had entered into recession in December 2011.

But after factoring in the falling value of the dollar over time, which results in the growth rate of trade between the two nations being overstated on the Chinese side of the trade balance, we find that China's economy really slipped into recession some two months earlier, in October 2011. This month coincides with the beginning of a period of contraction for China's manufacturing industries.

Going forward, we'll be using this improved version of our trade growth rate chart in our analysis of the relative economic health of both the United States and China.

Senin, 26 November 2012

Racing to Beat the Clock on the Dividend Cliff

On the first day of 2013, the amount of taxes that top U.S. stock market investors will have to pay on the dividends they earn will increase. The only question at this point is by how much. Will taxes on dividends rise from 15% to 18.8% because of the ObamaCare tax on investment income that will take effect on that date or will dividend taxes rise from 15% to 43.4% thanks to the additional tax increase related to the 2003 Bush-era tax cuts that are currently set to expire after the last day of 2012?

That question matters today because, as expected, influential investors are pushing companies to boost their dividend payouts in December 2012 to beat the clock on the dividend tax increases that will take place in 2013.

Here, because about two-thirds of all the ordinary and qualified dividends that will be subject to the higher dividend taxes are earned by people with household incomes over $250,000, at least if you go by the IRS' tax return statistics for 2009 [Excel spreadsheet], the most recent year for which data is available at this writing, and because these same people who will be most subject to the higher taxes are the ones who have the ability to affect the amount and timing of corporate dividend payments, all investors will be affected by their response to the tax increase. [We should note that this point will likely be lost on the more clueless commenters of Seeking Alpha.]

That brings up an interesting question. Where will the companies that act to boost their dividends in 2012 get the money to pay them?

Today, we can reveal that the companies acting to beat the clock on higher dividend taxes for their shareholders are pulling the money to pay them from the funds that they might otherwise have used to pay dividends in the first quarter of 2013:

Expected S&P 500 Quarterly Cash Dividends for Future Quarters

In our chart, we observe that the expected dividends expected to be paid out in the first quarter of 2013 has declined sharply in the weeks following the 6 November 2012 re-election of President Barack Obama, which ensured that these dividend tax increases would take place. Meanwhile, we see that the level of dividends expected to be paid out in later quarters of 2013 are very little changed - it would seem that only the amount of dividends expected to be paid in 2013-Q1 have been affected in the weeks since higher dividend taxes in the U.S. became a sure thing.

The reason why has to do with the way companies actually accumulate the funds to pay their dividends, where they set aside money well in advance of the dates the payments will be recorded, or transferred to their shareholders. Here, the actual funds to pay out dividends in 2012 are being pulled from the funds that are already being reserved to pay dividends in the first quarter of 2013.

So it's not personal and it's not something that reflects a worsening outlook for the U.S.' economic performance in the first quarter of 2013. It's simply a transfer of income from the future to the present for the purpose of avoiding tomorrow's higher taxes. Exactly the sort of rational actions that we should expect such influential investors to pursue in this situation.

As we close, we should note that these actions related to higher dividend taxes in 2013 are far from over. While the incentives are such that the immediate focus will be for companies to make either higher or special dividend payments in these last weeks of 2012, the ongoing incentives for dividend taxes are such that dividends cuts will be favored in federal tax law. And right now, there's no imperative for companies to rush to announce those kinds of negative changes in their dividend policies until after the end of the year.

Consider this thought experiment. We've shown that companies today are raiding the funds they've set aside to pay dividends to their shareholders in the first quarter of 2013 for the sake of racing to beat the clock on the dividend cliff. Where might they then get the funds to cover the amount of dividends that they are expected to pay out in 2013-Q1 without negatively affecting either the investors or the economy? Will they raid the funds being set aside to pay out dividends in the second quarter of 2013 or might they cut back on their other business expenses? Will they do it all over again when it comes time to pay out dividends in the second quarter of 2013? And what about the third quarter? How long can raiding the future for sustaining the expected benefits of the present continue?

At a certain point, things that cannot continue will stop. In this scenario, cutting dividends to shareholders will be the easiest way for the endless raids on the future to stop. When that happens, a lot of not-so-influential investors who rely on dividend income for things like their retirement or pension income can expect to find themselves worse off as a result of the federal government's actions to increase its taxes on dividends for the highest income earners.

And that's how those with incomes of less than $250,000 per year will share in the price of paying higher dividend taxes. Just because they don't write big checks to the I.R.S. doesn't mean they won't feel the pinch in their pocketbooks....

Major Dividend Event Timeline

Jumat, 23 November 2012

Two Easy Peer Feedback Methods

Peer feedback can be extremely valuable in the BE classroom, especially when it comes to communication skills.  There are two reasons for this.

First, my learners are typically all in the same company and/or department and have a better grasp of the conventions within the discourse community.  Second, the learners have years of experience and training in various areas which they can draw upon to give feedback.  For example, several of my learners include project managers who have taken part in many training sessions on relationship building and giving feedback.  It is great to spread that knowledge.

Of course there are many other great reasons for constructive peer feedback, but there are also dangers, too.  Without direction and some limits, peer feedback can be overly positive or only highlight shortcomings.

For example, here is some peer feedback I received on a proposal I wrote for a university class.


·         Your introduction is very wordy.  I would consider consolidating some of the paragraphs and cut back on so many words.  Once you write the Letter of Transmittal you will realize most of what you wrote in your introduction will also be in your Letter of Transmittal.  Your introduction should be concise and to the point. You use too much detail for the reader in the first two paragraphs, which led to repeating most in the body of your proposal.  
·         Your title page doesn’t include who you ultimately want to read your proposal.  In our textbook on page 289 the title page lists who it is prepared by and who it is prepared for.  The prepared for individual will also be the name you address your Letter of Transmittal to. 
·         I would also consider spelling out what R&D because readers may not understand the acronym. 
·         You are also missing table of contents, which is a requirement for the report.
·         When using visuals you should name them in the proposal i.e. Figure 1, Figure 2, etc. Also if you pulled your illustrations from somewhere else you need to cite those as well. 

Hardly motivating... did I do anything well?  By the way... I did fine on the final assignment.

A Simple 3-2-1

I like to use a simple 3-2-1 feedback format for peer feedback.  I simply write on the board prior to a presentation, meeting, email, etc.

Write:
3 things they did well.
2 things they can improve.
1 thing you want to take and use in your presentations, emails, etc.

Then after the simulation/role play, I give them time to fully write out their feedback for the person.  I do not read them and let the learner look at them without pressure after the lesson.  Typically, the learner will come back the next week and thank their classmates for the excellent responses.  Then when we are giving class presentations, all participants are more likely to give complete, honest, and constructive feedback because they will receive the same in return.

Email Workshops

A second method for extensive peer feedback is email workshops.  I will set up pair groups and give each pair the task to write an email.  Each situation will be similar.  Note:  I will change the emails based on the target function.

For example: (the learners are told to fill in details to fit their job/situation)


Group A
  • To introduce yourself to a new business contact.  You will be working together in the future.
Group B
  • To follow up on a conference.  You met the person for the first time and talked shortly, exchanged cards and agreed to stay in touch.
Group C
  • To get in touch with a former friend / colleague.  You were close before but lost touch after several years.  But now you may need some help from him / her.
Then, the pairs compare and contrast their emails based on subject line, greeting, opening, structure, opening for discussion/response, closing, formality, and length.

Then I will have someone run to the copy machine and make copies for everyone.  Note: I give them an email template on A4 paper with all the top fields and a writing area.

Then the members of the three different groups will read the other emails.  While they are reading, I will mark the emails for accuracy and vocabulary.

To conclude, the members of the groups will meet together and discuss dos and don'ts in there situations, good structure, appropriate phrases, etc.  We will bring all the information together on a powerpoint slide and that will go out to the participants.

The participants absolutely love it.

So, two ideas on how I use peer feedback in my classrooms.

Kamis, 22 November 2012

Busting Out of Black Friday

You know, it's bad enough that we see Christmas decorations start going up in some stores before the Fourth of July, but now, some big retailers just can't wait for dessert after Thanksgiving before trying to rack up more sales:

Retailers this year will open for Black Friday sales early enough to make shoppers choose between hot deals and hot apple pie after Thanksgiving dinner.

From Toys R Us to Target to Walmart, retailers are opening as early as 8 p.m. on Thanksgiving night.

Toys R Us announced Monday that its Black Friday will begin on Nov. 22 when doors open at 8 p.m, an hour earlier than last year.

To entice shoppers to line up even earlier, the toy retailer will give the first 200 customers at each location a free "Great Big Goody Bag" full of stocking-stuffers up to $30 in value.

"You can have your dinner, then come to our store. We all know that everybody gets burned out on turkey and football," says Troy Rice, chief of store operations, who expects stores to have lines from 500 to more than 1,000 people by the time doors open.

We think this is just a classic case of shifting consumer behavior, much like how sales tax holidays actually work. Here, instead of racking up more sales, as they might hope, U.S. retailers joining in this scheme are basically trading the timing of when their sales occur. It's not like consumers will have any more money to spend on an extra four hours of shopping....

Taking the Toys R Us promotion as an example, lining up to join in a bizarre shopping frenzy for $30 worth of "stocking-stuffers" (at Toys R Us' inflated "regular" prices - we suspect their actual cost for the items is around $10) some four hours earlier than retail tradition would dictate doesn't seem like that great a gain for the American consumer.

In the modern world, for those who just can't wait for the Black Friday shopping experience, there's no need to wait until 8:00 PM to get in on those Black Friday deals.... Or even to leave home....

The best part is that if enough consumers take advantage of the online alternatives, the other retailers looking to bust out of Black Friday will have to offer much, much better deals to consumers to try to draw them into their stores. And if doing that keeps their bottom line from going the way they might hope, they might be forced to stop the Black Friday bleedout because their sales don't justify the higher costs of having to be open longer.

And wouldn't that be a nice Thanksgiving treat!

A Thanksgiving Toast...

... from a movie that wasn't as popular at the box office as perhaps it ought to have been:

Happy Thanksgiving!

Rabu, 21 November 2012

Who is "Big Turkey"?

Big Turkey is our cute name for the U.S.' largest turkey producers. Our chart below ranks who they are by the total live weight of turkeys they processed in 2011:

U.S. Turkey Producers Ranked by Live Weight Processed, 2011

The top three companies in our rankings, Butterball, Jennie-O Turkey Store and Cargill, account for over half of all turkeys processed in the United States.

As we noted yesterday, "Big Turkey" really isn't very profitable. With an average net profit margin of 2.9%, turkey producers, which would be grouped in the "Meat Products" sector of U.S. industries, would rank 171 out of some 215 industrial sectors.

But that's better than it appears - each of the publicly-traded companies that make up the list of companies in the Meat Products industry sector process more kinds of meat than just turkey, which do more to contribute to their profit margins. If not for the turkey segment of their businesses, the sector would have a higher net profit margin.

Selasa, 20 November 2012

The Illusion of Prosperity for U.S. Turkey Producers

It is very hard to make money in the turkey business.

In fact, low profit margins are the main reason that Smithfield Foods (NYSE: SFD) sold off its 49% stake in Butterball, the top producer of turkeys in the United States, for $175 million back in September 2010.

But U.S. turkey producers would appear have been on a tear since 2003, collecting more and more revenue in almost each year and now having more than doubled after having had mostly flat incomes in the 14 preceding years.

Annual Turkey Farm Income (All Producers), 1990-2011

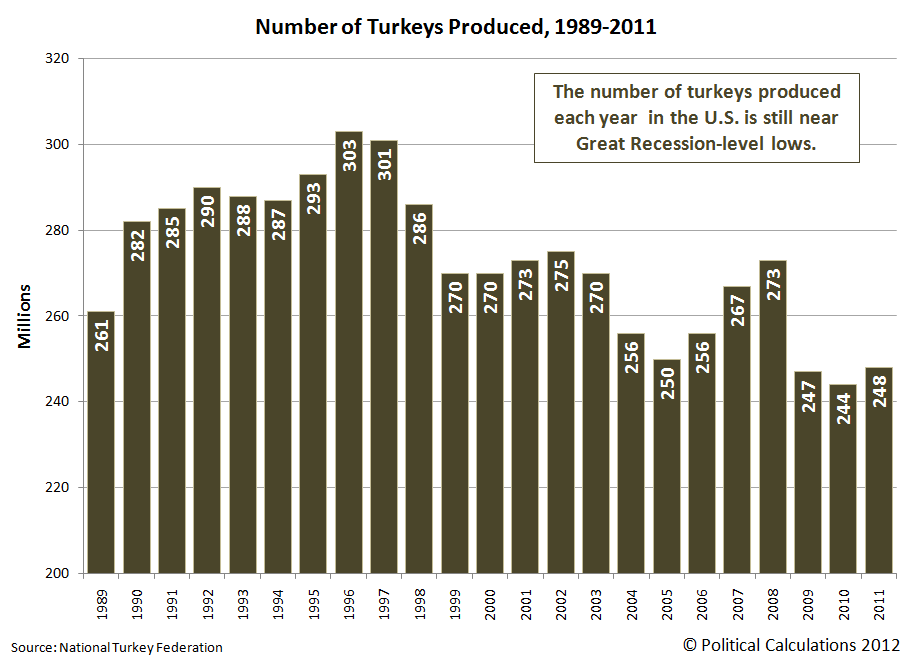
That increase in revenue becomes even more exaggerated when we consider the falling volume of turkeys produced over that time:

Number of Turkeys Produced, 1989-2011

Calculating the average income collected by turkey producers for each turkey they produce, we find that the average revenue collected per turkey has been rising at double-digit growth rates since 2003.

Average Farm Income per Turkey Produced, 1990-2011

And yet, "Big Turkey" is struggling to profit.

The only way this situation can exist is if the cost of producing turkeys in the United States to be rising at similar rates. Or more specifically, if U.S. turkey producers are directly passing on their higher costs of production to U.S. consumers on an almost dollar-for-dollar basis, which we can safely assume is the case given what we observe and the razor-thin profit margins for U.S. turkey producers.

So our question is what changed after 2003 that resulted in driving up the cost of producing turkeys in the United States in nearly every year since?

To find out, we began by looking at the main factors that can affect the cost of producing turkeys for market.

According to the University of Missouri's agriculture department, the cost of turkey feed can represent 70% of the cost of turkey production. With such a large share, we focused solely on this particular factor for our analysis.

Turkey feed typically consists of two main ingredients: soybeans and corn. Here, we observe that soybean prices suddenly spiked in 2003, then fell back to their pre-spike level in 2004 before beginning to increase in 2006. Meanwhile, the price of corn mostly held level until 2005, when it began to skyrocket in response to the U.S. federal government's increased ethanol fuel mandates - dipping only with the Great Recession in 2010.

The combination of the 2003 soybean price spike (which would be fed to turkeys in 2004) and the sharply increasing price of corn after 2005 would appear to account for nearly all of the increase in the cost of turkey production after 2003. Of the two, corn prices would appear to be the more significant driver, in that a larger and larger share of U.S. corn production has been required to be consumed to produce ethanol for use in motor vehicle fuel by the U.S. government over the years since 2005.

Percentage of U.S. Corn Crop Consumed by Ethanol Production and Corn Price per Bushel, 1980-2012

We should also note the role of the federal government's ethanol mandate in displacing other crop production, reducing supplies of those other crops while simultaneously increasing their costs at market.

And thus we discover the reality behind the illusion of prosperity for U.S. turkey producers. They've never generated more revenue, but they've never struggled so much to profit so little either.

That's the big reason why the industry isn't growing. The University of Missouri reflects on the role the industry's production cost increases have had on the state of the turkey business:

While such increases have boosted production costs of white meat and giblets, retail price pressure isn’t letting producers pass much to the consumer. Turkey eaters have reacted to price increases of almost eight percent over 2009 by eating more holiday ham and Thanksgiving pizza.

According to the US Department of Agriculture, turkey output dropped from 5,663 billion pounds in 2009 to 5,587 billion pounds last year, about a one percent reduction. Stocks of frozen whole birds also fell. Between September and October of last year, six percent fewer turkeys found themselves in freezers.

Grocers have tried to keep turkey prices low, even selling the birds below cost to attract holiday customers who load shopping cars with other goodies. With little opportunity to increase prices, producers have to eat higher costs to remain competitive.

In response, the turkey food industry now processes more meat into TV dinners, turkey ham and breasts, but this is only keeping pace with the decrease in holiday whole bird consumption. Annual consumption per capita has remained flat-lined for 30 years – about 16 pounds in some form, including Spam Turkey.

It is very hard to make money in the turkey business.

Senin, 19 November 2012

The Communicative Event... Session Recap

I heard my approach to needs analysis mentioned many times this past weekend at the BESIG conference and I am more than a little thrilled to have struck an issue which reached BE trainers.  As a relative new-comer to ELT I am always hesitant about saying how things should be done.  And at a place like BESIG, I am looking out at an audience which, in the case of the PCS, had well over a century of experience.

The purpose of this post is to recap my talk on Communicative Event Analysis, to add some background to the idea, and to reanswer some of the questions which were dealt with rather poorly in the session.

The Talk

During the talk I first outlined what I had learned from the needs analysis tools I see most often on the Internet, in trainer handbooks, or in course materials.  Unfortunately, due to a technical issue, the bullet points did not appear on-screen.  Please take a look at this version of the presentation for those items.


Context

It appears that the term 'communicative event' is gaining acceptance among some readers (and even non-readers) of my previous post "Why Needs Analysis Isn't Working".  Let me provide a little context about how I use this term.

For me a communicative event is anytime the learner is either the sender or receiver in the S/R communication model.  This is different than "an English situation".  In some cases, such as reading a document on the company intranet, the event "understanding and interpreting the information" is the entire situation.  However in many cases, such as a longer meeting or a company visit, there are many events in one situation.

Example 1

I have learners who make customer visits (the situation).  In this case there may be several events.
  • Reporting to reception
  • The initial greeting when being welcomed
  • Relationship building through small talk while walking to the conference room (or other area)
  • Meeting the others for the meeting
  • Talking about the agenda or plan for the visit
  • Starting the meeting
  • Presentation phase
  • Question phase
  • Discussion phase
  • and so on...
The idea with the form is to find the situation and start to define the communicative events.  But different cultures, discourse communities, job functions, and conventions will change the events conducted, the duration, and importance of those events.  My goal from the forms and the follow-up questions is to the find the order and importance of these events.  Artifacts such as old meeting agendas, mintues, slide decks, and emails make this much easier.  In general, however, I will try to focus on those events which are high value.  Reporting to reception is generally not high value.  For a secretary the small talk while going to the conference room will be much higher value than some others to create a welcoming first impression on the guest.

Example 2

Sometimes the communicative event is not directly linked to the situation.  I had a learner who worked in a call center.  At first thought, we needed to be working on telephoning, troubleshooting, politeness, etc.  However, her needs were actually quite different.

She was receiving the calls from German customers about problems with their telephone service.  But the company also had call centers in India.  Therefore, all the troublshooting guides on the Intranet were in English and all the incident tickets had to be written in English.  But she was speaking German on the phone.

So for the training, we needed to focus on quickly searching, reading, and interpreting the troubleshooting guides, and on writing short incident reports in English... all while speaking German.

Munby

Recently, I stumbled upon some past work on the communicative event from 1978 by John Munby.  It just goes to show that there is rarely a truly new idea.  Sadly, I have not even scratched the surface on his research, but it appears he advocated this approach to syllabus design long ago.  My initial impression is that he takes it a bit further (down to sentence level) with "micro-functions".

My apologies to Mr. Munby if I have inadvertently plagiarised his theories.  This was completely new to me until only recently.

Expertise, Assumptions and Materials

The main message I would like to give is three fold.  First, we are the language and communication experts in the room.  Asking the learners to map their own way to success is simply not effective.  Of course, we need to accomodate their goals and expectations.  But they do not know what a function is, they cannot name the words they don't know, and they cannot identify what makes their language different than their target.

Second, we cannot make assumptions that we know meetings, presentations, negotiations, etc.  Course books do an excellent job of providing functional phrases, but often assume that all meetings are the same and all presentations are alike.

Third, we cannot limit the learners' needs to what we know how to teach.  Many times what we know how to teach is either of marginal importance (e.g. making arrangements on the phone) or will not help alleviate their communication difficulties.  Tailor made training means just that... going out and developing original lessons and materials which will help our learners.  Of course, some recycling happens, but trotting out a different permutation of the same stuff is not ideal.

Question and Answer

I'd like to apologize to the audience (both around the world and in the room) for my poor responses to your excellent questions.  I was a bit overwhelmed by the simulcast, the technology challenges, being filmed, the time limit, and staying on script.  Thank you to the gentleman who politely helped me deal with one question.  So here is my second attempt.

Identifying needs for pre-experience learners or 'just-in-case' training

Very valid question... this method is generally limited to learners who currently use English in their workplace and have the goal of improving their immediate performance.  However, after having conducted this type of needs analysis for over a year, I do see patterns which can assist pre-experience learners.  Please check out my post "What I Don't Teach and Why".

One general thing I see in my market is that most communication is internal and virtual.  This means lots of information exchange on progress, processes, and rules but less persuasion and general conversation.  Communication is often reading and writing messages to conduct some kind of transactional information exchange.

For external contacts, I see more voice communication, but typically also little face-to-face contact.  Also, these external contacts are typically long-standing customers and preferred suppliers.  These conversations are more like colleagues than the more traditional customer-provider relationship.

I will also use my gained knowledge of communicative events from other learners to extrapolate what pre-experience learners are likely to be doing.  Sometimes these tasks are similar to what they are already doing in L1, and sometimes we have to make a few assumption based on job function (e.g. accounting, project management, etc.)  One note here is that most course books written for business management schools are heavy on strategy and business theory.  Most daily workplace communication is not about these topics.

Specfic lesson ideas from communicative events

The first thing is that it gives me a clear idea of which functions, grammar, and vocabulary to practice in certain contexts.  I know precisely what kind of authentic materials I should be looking and asking for.  Then, I have a pretty good idea of what to do with them when I have them.

During a role-play it gives a good idea of what roles to assign to whom, or how to change them to fit their real-world needs.  It also gives me an idea of how to design specific lessons.  For example, I have a group of secretaries and we recently rehearsed that long walk from reception to our conference room.  We made role cards for the 'visitors' like: 

You missed your connection in Amsterdam.  You are tired and hungry.  You want to be nice, but would rather not have small talk.  You are looking forward to the end of the meeting and you are dying for a cup of coffee and to know where the restroom is.

This is your first trip to Germany and you are really looking forward to it.  You want to do some sightseeing while you are here and pick up a few gifts.  You really hope the meetings can be short so you that you can look around on your own.

So, I hope that helps cover those two questions better than my spontaneous answers.

Sorry for the long post, below you can find the handout for the session and thanks to all who attended from around the world and in Stuttgart.

Handout - The Communicative Event