Tampilkan postingan dengan label SP 500. Tampilkan semua postingan

Selasa, 15 Oktober 2013

A New View of Future Expectations for the S&P 500

Now that Eugene Fama, Lars Peter Hansen and Robert Shiller have collectively been awarded the Economics Nobel prize for their insights into how asset prices work, insights that we both routinely apply and have extended in our own work, we'll take this opportunity to open up a new window for how all that applies to the S&P 500.

We'll do that by remaking our favorite chart - the one that shows how changes in the year-over-year growth rate of today's stock prices keep pace with changes in the year-over-year growth rates of the dividends per share that are expected at specific points of time in the future - replacing the dividend futures data we obtain from IndexArb with dividend futures data from the Chicago Board of Exchange, which are really different from one another. The chart below shows all that data for each future quarter's dividends going all the way from 3 January 2013 through 10 October 2013:

Change in Growth Rates of Expected Future Trailing Year Dividends per Share with Daily and 20-Day Moving Average of S&P 500 Stock Prices, through 10 October 2013

Each of the data series that apply for a future quarter's dividends per share represent the expectations that investors have for the amount of dividends they will earn in that quarter. In the absence of large sources of noise, or variance, changes in the growth rate of stock prices will closely track with the trajectories associated with a specific future quarter where investors collectively focus their forward-looking attention.

In the chart above, we see that's the case at the very beginning of 2013, where investors focused their attention on the expected future defined by the second quarter of 2013 in setting stock prices. The focus of investors remained on that quarter, which ended in June 2013, well into April 2013.

At that point, investors began shifting their forward-looking attention to the more distant future defined by the expectations for dividends associated with the first quarter of 2014. We observe this shift in focus in the transition of daily stock prices (the dotted blue line) from the data series for 2013-Q2 to 2014-Q1.

That attention stayed there until 19 July 2013, when stock prices suddenly deviated from where investors were focused in response to what we've called the Bernanke Noise Event. Here, investors reacted to the new information that Fed Chairman Ben Bernanke communicated at a press conference that the Fed was seriously considering tapering off its purchases of government-issued securities once certain economic targets were hit by sending stock prices considerably lower than they would otherwise have been set if only the expectations of future dividends to be paid in 2014-Q1 were driving them.

That reaction was more than the Fed was ready to handle at that time. It took a month of effort, but the Federal Reserve finally succeeded in restoring the expectation that investors previously had that there would be no tapering of its QE programs until 2014, which we observe in stock prices resuming to closely track the expectations for 2014-Q1's dividends. But then, positive economic data combined with statements by lesser Fed officials led investors to believe that the Fed could begin tapering its QE program before the end of the third quarter of 2013.

That set off a larger negative reaction in stock prices. Only here, investors shifted their focus away from the more distant future quarter of 2014-Q1 in setting stock prices to instead fully focus on the critical quarter of 2013-Q3. We observe that shift taking place from the end of the Bernanke Noise Event through the end of August 2013, which marked the high point for the expectation of investors that the Fed would being tapering its QE programs in September 2013.

And then, the real-time economic outlook for the U.S. economy began to take a turn back to the worse, leading investors to increasingly bet that the Fed would not act to cut back its QE programs at the end of 2013-Q3, which led to rising stock prices as investors refocused their attention toward 2014-Q1. The Fed then surprised many, including us, that it would not act in 2013-Q3 to trim its QE bond-buying spree, but in retrospect, the evidence from stock prices and the expectations for future dividends supports that interpretation of events.

Unfortunately, before they could make it back to the level that would be fully consistent with the expectations associated with 2014-Q1, a new negative noise event centered around the potential for a government shut down and partial default on the nation's debt reared its ugly head, causing stock prices to once again deviate away from the level they would otherwise be. And that brings us nearly up to the present.

If all this makes the stock market sound like a chaotic place, that's because it frequently is - but that doesn't mean there isn't a predictable order underlying it all. That's what lies beyond the work of newly-minted Nobel-prize winning economists Fama, Larsen and Shiller, whose work has made what we do possible.

Speaking of which, if you want to find out more about our work, it all begins here. You only have to review several years of worth of what we've worked out live, in real time, without the benefit of any sort of safety net to catch up to us!...

Notes: we've modified the chart in this post from previous versions by eliminating an additional scale factor of 12 that we were applying to both the changes in the growth rates of dividends and the change in the growth rate of stock prices, which was an artifact our annualizing the monthly data we were using when we first discovered the relationship between the two. Since this additional scale factor is applied to both dividends and stock prices, it effectively cancels out of our math describing how changes in the growth rates between the two are related, so we're taking this opportunity to dispense with it altogether.

Beyond that, we've also changed our amplification scale factor, which is the scale factor that matters in our math. This change was driven by our change in data sources, where there can be considerable differences between the dividend futures data reported by IndexArb and that reported by the CBOE. Using IndexArb's data, we had settled on a typical amplification scale factor of 9.0, while the factor we're opting to use for the present with the CBOE's data is 5.0.

Senin, 14 Oktober 2013

The Differences Between the Expected Futures for Dividends

We've previously discussed our sources for where we obtain the dividend futures data we use to track what investors expect at different points in time of the future, but we haven't shown how they compare with respect to one another, much less to how actual dividends per share play out!

We going to do that today using data for the just-ended third quarter of 2013. Our chart below shows how the data for 2013-Q3's expected cash dividends per share tracked from 3 January 2013 through the end of the calendar quarter on 30 September 2013:

Comparison of Expected Future for 2013-Q3 Cash Dividends per Share and Actual Final Value Reported by S&P, 3 Jan 2013 to 30 Sept 2013

As we noted before, the main difference between our primary sources of dividend futures data is how they determine how much the cash dividends per share will be at the end of the quarter they track. The Chicago Board of Exchange (CBOE) dividend futures contract uses a "top-down" approach, where the price of the contract is set by futures trading activity (if you access their data, the reported value is ten times the expected cash dividends per share for the quarter, so be prepared to shift the decimal point accordingly).

Meanwhile, IndexArb uses a "bottom-up" approach, which takes expected dividend per share data from each of the S&P 500's component companies and weights them according to their market capitalization within the index to create its expected cash dividend per share value. IndexArb also complicates its reporting for future quarters as the information it provides really indicates the total amount of estimated dividends per share for the index that will be paid out between the present (today) and the end of the dividends futures contracts upon which they're based.

That means that to find the expected amount of dividends per share that will be paid out in a given quarter, you have to take the total amount of dividends per share that will be paid out by the end of that quarter and subtract the total amount of dividends per share that will be paid out by the end of the preceding quarter. So, if we want to do find the value for 2013-Q3, we have to subtract the dividends per share that would be paid out by 2013-Q2 from it!

That creates some problems, which you can see in the chart above. Here, the data for 2013-Q3 from IndexArb effectively flatlines at the expiration of the dividend futures contract for 2013-Q2 on the third Friday of June 2013 (21 June 2013), because the futures data for the preceding quarter is no longer available for us to do that subtraction operation.

Market Volatility - Source: Schweitz Finance

We can also see differences in how the values start and change over time. Here, the CBOE's dividend futures data starts and a higher value than IndexArb's, but is subject to greater volatility, which you would expect given how its value is set.

The IndexArb data is less volatile, and although it begins at a lower value, we can see that it converges toward the values that the CBOE projects, at least through the end of the preceding quarter's data. Based on the trend we observe in the data before that time, we think that the two would converge very close to each other by the actual expiration of the dividend futures contracts on 20 September 2013.

Meanwhile, both of the expected dividend values for both sources fell short of the actual level of cash dividends per share of $8.909 that S&P reported for 2013-Q3 after the end of the calendar quarter on 30 September 2013.

We think the primary source of the discrepancy between the dividend futures and the actual value for cash dividends per share can be traced to the estimate of each S&P 500 component company's weighting within the index. S&P is the final arbiter of those values, while estimates used by others are just that - estimates. We should also note that there is also a bit of mismatch between the terms of the dividend futures contracts and the dividends that are paid out by the ends of the calendar quarters that S&P reports, which may also account for a good portion of the discrepancy between the futures and the actual data once it is reported.

Given our experience in tracking the data, what we find to be really remarkable that the dividend futures data is typically within a 3% margin of S&P's officially recorded value (that's true even of the three-month earlier cutoff for IndexArb in the absence of a real market-shaking event), and often, is within a much closer margin of error than that.

Speaking of which, since the CBOE data stays "live" longer than the IndexArb data, our next update of our favorite chart will be based solely on the CBOE's data, which we're going to unveil tomorrow. We were going to wait to do that development until our annual end of year hiatus, but it turned out to be a snap to do, and there's some really interesting insights that come out of it!

Image Credit: Schweitz Finance.

Data Sources

EODData. Implied Forward Dividends September (DVST). [Online Database]. Accessed 7 October 2013.

IndexArb. Dividend Analysis. [Online Data Report]. Accessed daily from 3 January 2013 through 21 June 2013.

Standard and Poor. S&P 500 Index Earnings and Estimates. [Excel Spreadsheet]. Accessed 7 October 2013.


Selasa, 08 Oktober 2013

The Noisy Irritant Strikes Again!

Take a look at the following chart, a snapshot of the trading activity on 8 October 2013 through 2:02 PM EDT:

Snapshot of S&P 500 Index Value, 8 October 2013, through 2:02 PM EDT - Source: Google Finance

Now, looking at that chart, we can identify 10:46 AM EDT as the approximate point in time, give or take a minute, at which the investors suddenly reacted negatively to some event. Since it typically takes investors just two to four minutes to react to an event they weren't expecting, that actually market the end of the period of time in which we would need to look for a market moving event. Want to guess what major market moving news hit the wires within that window of time?

We won't keep you in suspense. The noisy irritant in the White House is behaving as we expected. USA Today's David Jackson reports:

President Obama called House Speaker John Boehner on Tuesday, again telling the Ohio Republican he will not negotiate on budget items until the GOP-run House ends the shutdown and raises the debt ceiling.

Obama also scheduled a White House statement on the budget shutdown for 2 p.m.; he will also take questions from reporters.

"The president is willing to negotiate with Republicans -- after the threat of government shutdown and default have been removed -- over policies that Republicans think would strengthen the country," said a White House readout of the 10:45 a.m. phone call to the House speaker.

The readout noted that Obama "repeated what he told (Boehner) when they met at the White House last week."

Boehner spokesman Brendan Buck confirmed the conversation, saying that "the president called the speaker again today to reiterate that he won't negotiate on a government funding bill or debt limit increase."

Now, that's what we would describe as a presidential-class tantrum, especially because the President had to go out of his way to deliver it.

A Microrecession Dead Cat Bounce?

We may have been too optimistic last month in noting the end of a year-long period of microrecession in the U.S. economy.

Here, we've been tracking the number of public U.S. companies that have been announcing decreases in their dividends each month. August 2013 had seen the number of U.S. companies acting to cut their dividends drop below the key level of 10 per month, which we've previously observed marks the boundary between a growing U.S. economy and a U.S. economy that is experiencing recessionary conditions.

The data for September 2013 is now out, and the early suggestion is that the U.S. economy is not yet out of the woods.

Monthly Number of Public U.S. Companies Posting Dividend Decreases, January 2004 through September 2013

As we ask in the chart, is this a proverbial dead cat bounce (a one-time event as the number of companies acting to cut their dividends bounces back into recessionary territory) or is the U.S. economy experiencing the same kind of recessionary conditions that characterized the entire year from July 2012 through July 2013?

Dead Cat Bounce - Source: InvestmentPath.com

There are two things of which we can be sure. Neither the impact of the partial U.S. government shutdown, which didn't even begin until 1 October 2013, nor the potential impact of a U.S. Treasury default on the U.S. national debt that President Obama has planned for 17 October 2013 are responsible for this outcome.

Instead, since the number of public U.S. companies announcing dividend cuts each month is perhaps the single best indicator of the real-time health of the private sector of the U.S. economy, what the data for September 2013 really suggests is that the U.S. economy is quite not as strong as the previous data indicated.

And that could be a more significant factor in driving today's stock prices than the increasing level of political noise emanating from Washington D.C.

Image Credit: InvestmentPaths.com.

Senin, 07 Oktober 2013

Nice Market You Have There. Shame If Something Should Happen To It.

We're not going to update our favorite chart this week, as we're still busy modifying it to cover the activity we anticipate into 2014. So instead, we thought we'd analyze the biggest market action, or non-action as the case really was, from last week!

Our story all begins with President Obama's interview with CNBC at market close on Wednesday, 2 October 2013 (transcript available):

By the next morning, the market had reacted in such a way to the President's comments that CNBC was compelled to report how investors were interpreting them, which is reflected in our original headline for this post. CNBC's Finance Editor Jeff Cox writes in Wall Street wonders if Obama wants a selloff:

In an exclusive interview with CNBC, the president warned Wall Street that this shutdown could be different. Previous halts in nonessential government activities have caused little market reaction, with major averages actually rising most of the time in the month after the shutdowns are settled.

Obama's remarks indicated to some observers that he is trying to push investors out of the relative complacency they have shown so far. Futures were broadly lower Thursday, indicating markets may be taking heed.

"They feel that a severe market selloff would be helpful to break the logjam," said Greg Valliere, chief political strategist at Potomac Research Group in Washington. "It would be helpful in making the Republicans sue for peace. Obama and [Senate minority leader] Harry Reid believe that."

If President Obama was looking to trigger a selloff for Thursday, he succeeded. The chart below shows the trajectory of the S&P 500 from Monday, 30 September 2013 through Friday, 4 October 2013. Note the movement on Thursday, 3 October 2013:

S&P 500 from 30 September 2013 through 4 October 2013 - Source: Google Finance

In the first hour after opening, the S&P 500 index fell 10 points in the first hour before stabilizing, holding at a level of about 1678 until 11:26 AM EDT. That was the point in time at which the news broke that Christine Lagarde, the head of the International Monetary Fund, who shares political connections with President Obama in Chicago, was warning of the potential impact that a debt default by the Obama administration would have on the world economy (the linked article was originally posted at 11:26 AM EDT).

That news was sufficient to take the S&P to its low of 1671 for the day, hitting bottom just after noon had keeping near that level until 12:26 PM EDT.

What happened next was perhaps the most remarkable event of the day. At 12:19 PM EDT, he New York Times reported that the Speaker of the U.S. House of Representatives, John Boehner, had told colleagues that he was "determined to avoid a federal default and is willing to pass a measure through a combination of Republican and Democratic votes", which investors apparently took several minutes to absorb before reacting.

Their reaction was sufficient to wipe out the effect of IMF head Christine Lagarde's comments, and the market bounced back up to the 1680 level before trading in a narrow range between 1678 and 1682 for the rest of the day, closing at the low end of that range. By the end of trading on Friday, 4 October 2013, the market had wiped out the negative impact of President Obama's threatened default altogether, as it recovered to its pre-Obama threatening warning level.

Who's Afraid of the Big Bad Wolf Record - Source: Wikipedia

What we find interesting in all this is that there was so little effect on the market from the noise contributed by each of these political actors. The current President of the United States of America, Barack Obama, in seeking to create a market selloff to exploit for his own political advantage, couldn't huff and puff enough to make the S&P 500 blow down by much more than 10 points. Meanwhile, the comments of the head of he International Monetary Fund, Christine Lagarde, who owes her position to President Obama's patronage, only succeeded in pushing it down another seven points.

By contrast, the Speaker of the House of Representatives John Boehner's comments reassured the markets enough to recover by anywhere from 7 to 12 points. Put another way, his calming influence cancelled out the negative influence of head of the IMF and, for good portion of that Thursday afternoon, periodically exceeded the negative influence of the President in terms of total point movement.

Perhaps things will change and President Obama's negative influence will grow as we get closer to the President's planned default date. For now though, it's pretty plain that the market isn't reacting the way that President Obama wants, as the market's action on Thursday, 3 October 2013 indicates that it largely views him as a noisy irritant. That's not something that the President can long afford to continue if he wants avoid an early lame duck status, so we think it's likely that he'll instead increase his level of apparent irrationality in refusing to compromise on implementing his increasingly-troubled "affordable" health insurance initiative and his desire to sustain excessive levels of government spending.

Consequently, we expect the political noise affecting the markets to continue and grow louder. We're pretty sure that the markets would really rather get back to real business and not have to continue paying attention to irrational and ineffective executive leadership in Washington D.C. But then, that's the kind of leadership that emanates from the nation's capitol these days.

Senin, 30 September 2013

Assessing the Real Risk of a U.S. Debt Default

In our previous analysis of the S&P 500, we indicated that we expected that stock prices might fall in the very near term in response to both profit-taking and the arrival of a new negative noise event associated with the possibility of a partial federal government shutdown in October 2013.

Sure enough, we can say we saw it coming! We'll squeeze just a little bit more information into the current version before we officially revise it to move past the third quarter of 2013 to show how these things have played out:

Change in Growth Rates of Expected Future Trailing Year Dividends per Share with Daily and 20-Day Moving Average of S&P 500 Stock Prices, through 27 September 2013

The profit-taking is pretty easy to understand, as the stock market enjoyed a run up in prices through much of September 2013 in anticipation that the Fed would not cut back on its current quantitative easing programs. But what about the possibility of a new negative noise event?

That's tougher to tell. Here, we're going to start our analysis today by looking at a bit of data being advanced by at least one uncritical left-wing economist that markets believe that the United States is at a sharply increasing risk of defaulting on its national debt.

Here's what the WSJ article he cites says:

President Barack Obama repeated Thursday that he won't negotiate on the debt ceiling and won't sign any bill that defunds or delays the health-care law. He lashed out at Republicans for what he said were moves endangering the full faith and credit of the country. "You don't mess with that," he said in a speech in Largo, Md.

The Congressional Budget Office has estimated that if the debt ceiling isn't raised, the government will be unable to pay all its obligations sometime in late October.

Investors appear to be eyeing the possibility that the issue won't be resolved, judging by the sixfold increase in the past week—to its highest level since 2011—of the annual cost of derivatives some investors use to hedge against the risk the U.S. will default on its debt.

The WSJ's chart shows how the value of the investment derivatives tied to the risk of a U.S. government debt default have changed since July 2013. But this bit of information is why we describe the left-wing economist as being uncritical, because he is taking it at face value without any apparent understanding of what it is really communicating.

Once upon a time, these kind of credit derivatives, or as they are more commonly known, Credit Default Swaps (CDS), were used by investors to hedge against the risk that an entity, say a firm or a sovereign nation, would default on its debt.

Back in 2011, they were very successful in communicating the risk that a number of European nations were increasingly at risk of defaulting on their debts. So much so that the people who run the European Union scapegoated the trading of credit derivatives for the problems of its failing nations and took steps to effectively ban them by starving them of the liquidity they would need to function as a tool that clearly communicates the risk of default.

This is significant because, as you'll note on the WSJ's chart, that risk is denominated in Euros, not U.S. dollars.

As a result of the EU's actions, credit default swaps are no longer capable of communicating the real risk of whether a nation might default on their debt. Reuters explains:

"Sovereign CDS volumes and liquidity are down massively," said Michael Hampden-Turner, credit strategist at Citigroup. "Part of that is because investors are more optimistic about risk generally, but the EU ban has also hurt liquidity."

"The market tends to be fairly one-way round, leaving it vulnerable to gapping spreads when there is activity. Dealers are not prepared to run big positions as there is nowhere to lay the risk off, which makes it worse. Every quarter volumes slide and CDS becomes less liquid, and that looks set to continue."

[...]

This is a marked change from the pre-ban era, when CDS trading would pick up when a sovereign became more stressed and it was viewed as an important pricing point.

So, if these kinds of credit derivatives are no longer effective communicators of the degree of risk that a nation might potentially default on its debt, what is? Reuters answers:

"People pricing sovereign risk now look at the bonds, so why would you look at the CDS if bonds are where the information lies? Back in the day it was the other way around, with CDS levels being the crucial signal - it's a fundamental change," said Paul McNamara, investment director at GAM.

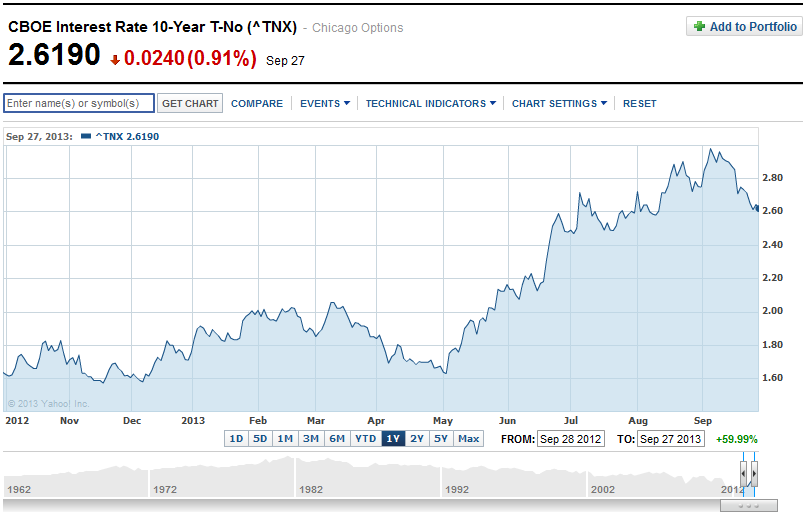
So, let's look at the yields of U.S. government-issued bonds. Here, if the risk of the U.S. government really defaulting upon its debt had really increased, we would see a spike in bond yields - the interest rates that the U.S. government pays to its lenders. Our first chart shows the yield for the benchmark 10-Year U.S. Treasury for the past year through 27 September 2013:

10-Year U.S. Treasury Yield - Source: Yahoo! Finance

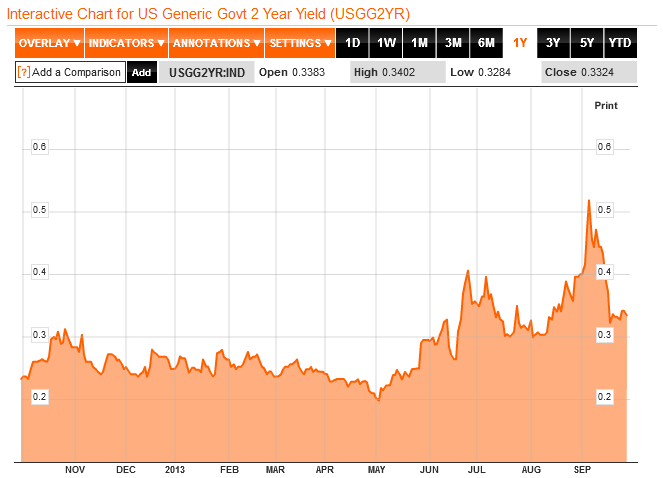
Let's next look at a shorter term bond - the 2-Year U.S. Treasury, which might show a more pronounced response to the near term risk of a U.S. default:

2-Year U.S. Treasury Yield - Source: Bloomberg

It doesn't do us much good to look at shorter-term U.S. Treasuries, because the Federal Reserve's Quantitative Easing (QE) program has pushed their yields down to near-zero levels. This outcome is specifically the result of what we describe as QE 4.0, which is the portion of the Fed's current QE programs that buys up U.S. Treasuries. QE 4.0 was announced back on 12 December 2012 to offset the imminent risk of a sharp contraction in the U.S. economy resulting from President Obama's desired tax hikes going into effect in 2013, and it has largely succeeded in keeping the U.S. economy out of a full-fledged recession.

In both these charts, we see the effect of the risk of the Fed cutting back on its purchases of U.S. Treasuries through its QE programs. From the beginning of May 2013, the yield on U.S. Treasuries rose in direct response to the likelihood that the Fed would begin tapering as early as September 2013, which was largely based on the perception of a strengthening U.S. economy. That probability peaked in early September, after which it became clearer that the Fed was less likely to act to taper its QE programs in September as the economy isn't recovering from being in microrecession as strongly as some data would indicate.

Stock Market Chaos Through this period, both President Obama and the U.S. Treasury Secretary Jack Lew have made statements indicating that they would refuse to negotiate with congressional leaders to avoid a government shutdown or a default on the U.S. national debt, which they targeted to occur in mid-October 2013. The yields of U.S. Treasuries did not react meaningfully to their statements as we should expect if markets really believed that the risk of a U.S. default had increased.

Their most recent statements came on Friday, 27 September 2013, once again emphasizing that President Obama would refuse to negotiate to avoid either a debt default or a partial shutdown of federal government operations. The yields for both the 2-Year and 10-Year U.S. Treasuries declined in response. If President Obama's claims had more credibility, yields on U.S. Treasuries would have risen in response.

But the spreads of the very lightly-traded CDS spreads for U.S. sovereign debt did, suddenly, within the last week - a jump so pronounced in the absence of any confirmation of a similar change in the yields of U.S. Treasuries that it is most likely attributable to a very small change the trading volume for it.

That kind of volatility is often a characteristic of low-volume trading activity in a market with low liquidity. It simply doesn't take very much money to create significant price changes.

It's kind of like how Intrade's prediction market for the 2012 U.S. Presidential election outcome was briefly manipulated to favor Mitt Romney following one of the presidential debates, only here, the manipulator of the market for U.S.' sovereign credit default swaps would appear to find President Obama's statements and policies to be credible.

The good news, if you can call it that, is that because of that fact, we know it wasn't the Russians, Iranians or Syrians. In this day and age, you have to take the good news where you can find it!

Senin, 23 September 2013

The Conveyance Effect

Occasionally, our readers keep us on our toes by asking really good questions. Today, we're going to share part of an e-mail exchange we recently had, in which we get into the nature of when, where, why and how the analytical methods we've developed to anticipate what stock prices will or should be will work. We reckon its a good time to fit that discussion into a regular post since we doubled up on our ongoing series of weekly observations on how the S&P 500 is behaving last week, and because its always a great time to identify and describe a phenomenon that many professional investors may not even know exists.

Here's the e-mail that kicked off the discussion, followed by our response, which we've enhanced by adding links and charts, as well as some text for clarification in boldface font. Enjoy!

I have really been enjoying the S&P 500 posts lately concerning index value vs. trailing year dividends.

Not to make things more complicated than they need to be, but have you ever considered breaking it down into sectors? Would that help to explain even further what is going on in the market?

I ask this question because I think of things like the 2007-2009 market decline. If you just look at the S&P500 index value, you may not have realized the market was in a major decline until early to mid 2008. If you looked at the sectors (e.g., XLB, XLE, XLF, XLI, XLK, XLP, XLU, XLV, XLY) you would have seen that most of the market sectors were in decline since 2006 or 2007, except for energy and basic materials. They were keeping the index afloat. It would only be a matter of time before they collapsed, too.

I realize that looking at your index vs. trailing year dividends, it's much more obvious that something was up with the market, going from order, to disorder. I just wonder if it would be even more clear if it was broken down on a sector by sector basis.

Thanks for your comments and question!

The main challenge for what you describe is the available data. While it's easy to get the market-cap weighted values for each sector's stock prices, getting market-cap weighted dividend data for the various sectors is a little more difficult (we would have to take each component stock's projected future dividends per share for each sector and weight them according to their market cap within the sector, which would be pretty time consuming.)

Aside from that, we would also see greater volatility in the price portion of the data, since we would be looking at a smaller section of the market.

Apple provides a pretty good example of what we mean here. Individual stock prices, like Apple's, are really volatile over time, as there is often a lot of speculation (or noise) affecting them in addition to the more fundamental driver of their dividends (or signal). If you recall last year, Apple's stock price ran up considerably in the months and weeks leading up to their announcement that they would initiate a cash dividend on the speculation that they would do so.

Percentage Change in APPL and SP500 Stock Prices from 16 December 2011 through 09 April 2012

After they announced it, Apple's stock price began to fall. But the S&P 500, of which it became the largest component, did not, even though it had been rising with it.

Percentage Change in APPL and SP500 Stock Prices from 16 December 2011 through 09 April 2012

The reason why is because of an effect that we'll call "conveyance". Here, Apple's stock price rose on the speculation of investors who on having bought on the rumor, after their dividend announcement, sold on the news.

Much of that money stayed in the stock market, going to buy other stocks as investors sold off their shares of Apple as they rebalanced their portfolios. That rebalancing, in turn, allowed the S&P to keep rising (and sustain its value), keeping in tune with the index' increased level of dividends. In effect, Apple's dividend was conveyed throughout the entire index, supporting its (the index') valuation, even though Apple's stock price itself fell in the weeks and months that followed.

We capture that effect in looking at the entire index, but can lose the strong correlation when looking at sectors or individual stocks, where the conveyance effect can be affected by investors rotating into or out of particular sectors or stocks, making them much more volatile than the index as a whole.


S&P 500 Average Monthly Index Value vs Trailing Year Dividends per Share, December 1991 through August 2013

Quick history: The starting and ending dates we selected for our charts above coincide with the date at which dividend futures contracts for 2011-Q4 and 2012-Q2 expired. The serious speculation that Apple would initiate a dividend began after the expiration of the 2011-Q4 futures contracts. Apple made the announcement that it would begin paying a dividend on Monday, 19 March 2013.

Its stock price was buoyed up for another three weeks as the speculative bubble inflated (see our third chart in this post), peaking on 9 April 2012 as investors finally began to realize that the company's stock price was getting too disconnected from where its own fundamentals would place it, after which the conveyance effect really kicked in.

You can see that in the second chart that we've added to our original exchange above, where most of the conveyance effect took place between 9 April 2012 and 30 April 2012, after which Apple's stock price and the rest of the S&P 500 resumed following mostly matching trajectories, which is what we should expect for the new 800-pound gorilla of the S&P 500.

Since the end of the Apple speculative bubble in May 2012, the S&P 500 has mostly followed a stable trajectory, as the market has largely continued in the period of relative order that began in August 2011.

Kamis, 19 September 2013

The Fed's Surprising Decision and Its Next Decisions

Yesterday's announcement by the Federal Reserve that it will not begin reducing its purchases of U.S. Treasuries and mortgage-backed securities with newly created money (a.k.a. "Quantitative Easing" or simply, QE) was a surprise.

Or was it really?

You would have to count us among those who were surprised that the Fed decided to hold off on trimming its $85 billion per month on average security-buying spree. We fully expected that the Fed was going to announce that it would reduce its pace of acquisitions by somewhere between $10 and $20 billion per month, which we base on our assessment that the U.S. economy has finally begun to recover from a year-long microrecession.

But was it really a surprise to all investors across the board?

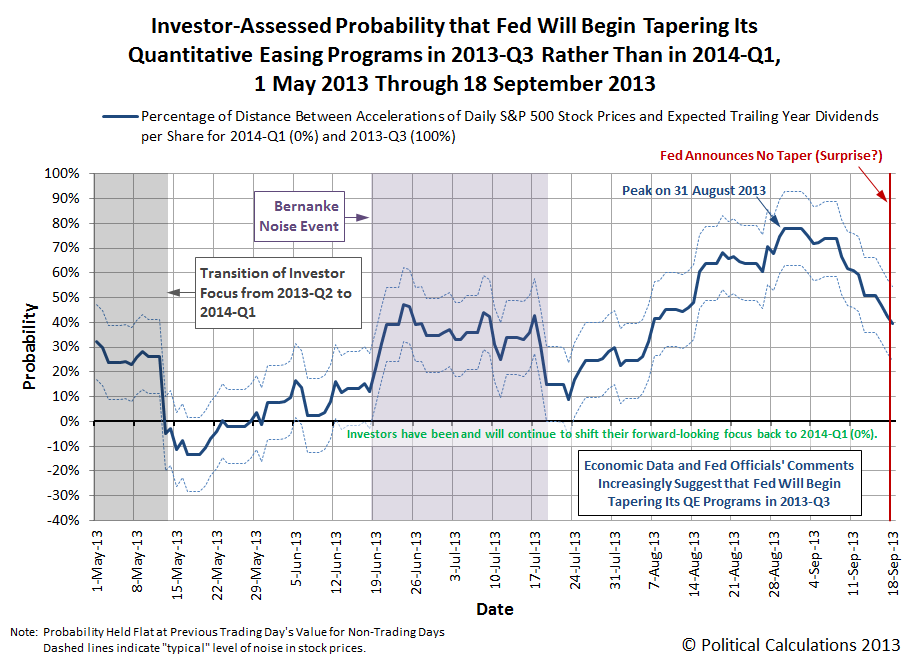
The reason we ask that question is because the unique measure of probability that we developed specifically to determine how likely that investors collectively believe that the Fed might announce that it would reduce its QE purchases this month, rather than in 2014, has been sending a very different signal for weeks:

Investor-Assessed Probability that the Federal Reserve Will Begin Tapering Its QE Programs in 2013-Q3 or 2014-Q1

As we can see in the chart, our estimated probability that the Fed would taper sooner peaked at 78% (with a typical margin of error of +/- 15%) on 31 August 2013. Since then however, that probability has itself tapered off, and going into 18 September 2013, the day of the Fed's announcement, it had been cut nearly in half to 42%.

We had interpreted that decrease as being consistent with investors shifting their forward-looking focus for setting their expectations for stock prices to the more distant future. We reasoned that since there was so little time left in 2013-Q3, there was little point for investors to continue speculating on the future of the Fed's QE program, since the clock was ticking down on both when the Fed would make its announcement and the effective end of the quarter (the dividend futures contracts for 2013-Q3 expire this upcoming Friday, 20 September 2013).

We reckoned that investors were shifting their attention to the first quarter of 2014 in setting their expectations for making their investment decisions. And paradoxically, that's exactly the same outcome we would expect for a future where the Fed would choose to delay trimming back on its QE program.

So what if a number of influential investors had instead come to the conclusion that the Fed would sustain its current pace of security acquisitions for its QE program? Anticipating the upward market move that would accompany such a policy adjustment, could they have been buying up stocks at comparatively low prices in advance of the announcement, driving up stock prices in such a way that they were really communicating that the Fed would keep the status quo with its QE program?

We don't know if we'll ever find out the answer to that one, except perhaps by how much profit-taking now takes place over the next few weeks now that the Fed's announcement is behind us. It's just a good thing that one way or another, the market was shifting to focus on the future as defined by 2014-Q1, which has meant, and will continue to mean, generally rising stock prices in the absence of a significant level of new noise in the market.

Speaking of which, the leading contender for a new negative noise event at this time would be a partial federal government shutdown sometime in October 2013. That potential perhaps explains why the Fed opted to continue its program, since it has already proven itself to be capable of offsetting bad and ineffective fiscal policies emanating from Washington D.C.

And if the Fed really wanted to send a message to the people in Washington D.C. who really need to receive it, it would act to boost its QE efforts by 60% of the amount that federal government spending would be reduced in the event of such a partial government shutdown, since this additional amount of QE would be sufficient to completely offset the negative fiscal drag on the nation's GDP that would result from such a partial shutdown.

After all, there's really no good reason to put the rest of the American people through any more economic hardship because of poor fiscal policies emanating from Washington D.C. At long last, perhaps its time for the politicians and bureaucrats to pay the price for their bad behavior, and the best way to target them is to let them go through the kabuki theater of a government shutdown, but to offset it with enough QE so that regular Americans would be hardly affected by their actions.

Is there anything worse for a politician or a bureaucrat than finding out that they don't have the power they think they do? In this case, would there be any better public service that the Fed could perform for the American people?

Senin, 16 September 2013

S&P 500 Expectations: Back to the More Distant Future

As we expected, with the Federal Reserve's tapering of its current QE programs now a near certainty, investors have begun shifting their attention to a more distant future quarter.

More specifically, they're shifting their attention away from 2013-Q3, the quarter that investors have associated with the Fed acting to begin reducing the pace of its acquisitions of U.S. Treasuries and Mortgage-Backed Securities, back toward 2014-Q1.

Change in the Growth Rates of Expected Future Trailing Year Dividends per Share with Daily and 20-Day Moving Average of S&P 500 Stock Prices, through 13 September 2013

Compared to the previous version of this chart, the path of daily stock prices, as indicated by the dashed blue line, is now moving rapidly away from the expectations of the change in the growth rate of future dividend income associated with the current 2013-Q3 quarter back toward the expectations associated with 2014-Q1.

Hourglass - Source: http://www.blm.gov/ut/st/en/prog/more/cultural/Paleontology/Paleontological_Permitting/blm_ut_permittees.html

There's more to this transition than just the locking-in of the expectation that the Fed will taper its QE programs sooner. We're also running out of future for investors to focus upon in 2013-Q3 as well!

By that, we mean that for all practical purposes, the future left to run in 2013-Q3 will run out this upcoming Friday, 20 September 2013, as the dividend futures contracts for 2013-Q3 are set to expire on that date. Since last week, there is very little benefit left for investors to continue shaping any portion of their investment decisions based upon the expectations related to 2013-Q3.

As a result, instead of being 74% of the way from 2014-Q1 (0%) to 2013-Q3 (100%) on our chart, daily stock prices (the dashed blue line) have risen to be just 49% of that distance. In the absence of any major new noise events, we would anticipate that stock prices will continue to generally rise as investors fully refocus their forward-looking attention on this quarter.

There is one wild card we haven't mentioned on our chart above. With the expiration of the dividend futures contract for 2013-Q3, we'll soon have that data replaced by that for the futures contract of 2014-Q3. It's possible that investors might focus upon that quarter, but we believe unlikely at this time, as it would make more sense for investors to focus on the nearer term that would coincide with the period of time in which most companies would implement any major changes in their dividend policies related to changes in their future business outlook.

Update 16 September 2013, 9:10 AM EDT: As a side note, we wrote this analysis on Friday, 13 September 2013, long before the news of Larry Summers withdrawal from consideration became news on the afternoon of Sunday, 15 September 2013. Shortly after the news came out, we posted our thoughts on how the market would react to Summers' withdrawal on Monday over at Barry Ritholtz' blog, before the stock price futures for 16 September 2013 came out - it would seem all is going as we expected....

Selasa, 10 September 2013

The Evolution of Investor Expectations for the Future of QE

What we're about to show you is only possible because of the work we've done to describe how stock prices change in response to the changes in the fundamental factor that drives them: expectations of the amount of cash dividends per share that will be paid out to investors in the future. Because we are able to isolate the effect of this fundamental driver on stock prices, we can determine the extent to which they respond to other, non-fundamental factors.

Typically, we would describe these non-fundamental factors as "noise", because they contribute to the apparently random variation of stock prices over time, mainly as investors react and sometimes overreact to new information. Most often, there are multiple sources of noise that affect stock prices, which makes the stock market a pretty noisy place, even in typical circumstances.

Meet Your Expectations - Source: coolspot.gov

But sometimes, there is a single source of noise that is so "loud" that it seriously skews stock prices away from the levels that they would otherwise be if we went just by their fundamental drivers. The expectation of what the Fed will do with its Quantitative Easing (QE) programs and when it will do it is just such a loud source of noise.

The reason why that's the case is because the Fed's latest QE effort is fully responsible for virtually all of the nation's economic growth since the third quarter of 2012. Since the Fed's latest QE program was first announced in September 2012, the Fed has effectively put the tab for overcoming all the fiscal drag from minor government spending cuts and major tax hikes and all of the positive economic growth in the nation's GDP above its 2013-Q3 level on its balance sheet through its QE programs.

Clearly then, what happens with the Fed's QE programs is of great interest to investors, because of their effect upon investments. It really shouldn't be any surprise that they have reacted whenever there has been any inkling of a potential change in what the Fed will do with those programs.

Our chart below shows how they have reacted to all the news and noise related to those potential changes, using the expectations for the future dividends per share for the S&P 500 that will be paid by the end of 2013-Q3 and 2014-Q1 as the fundamental benchmarks against which we can measure the changing expectations related to the future for the Fed's QE program.

Investor-Perceived Probability that Fed will begin Tapering Its QE Programs in 2013-Q3 vs 2014-Q1, 1 May 2013 through 9 September 2013

In the chart above, a 0% reading indicates that investors are fully focused on 2014-Q1 in setting their expectations for buying and selling stocks, which also coincides with the expectation that the Fed would not change their QE program until 2014. By contrast, a 100% reading would be an indication that investors have fully shifted their attention to 2013-Q3, which corresponds to the expectation that the Fed will begin drawing down its QE program in that quarter.

Generally speaking, an increase in the probability of an early tapering for QE shown in the chart above coincides with a decrease in stock prices.

Now let's match up the action on the chart with history. The word that the Fed might begin scaling back the purchases of the mortgage-backed securities (MBS) and U.S. Treasuries that make up the core of its QE programs first came in early May 2013. At the time, stock market investors were transitioning their forward-looking focus for the dividends per share they expect to earn from the second quarter of 2013 to the first quarter of 2014, so that news was not paid much attention as they shifted their focus to a new set of expectations for the future in deciding how much of which stocks to buy or sell.

So they didn't put much stock into the possibility that the Fed might trim back its MBS and Treasury buys before the end of 2013 at the time. It was a trivial consideration as investors were focusing in on a new set of expectations for the future where their investments were concerned, and any effect that it might have had on stock prices was lost in the typical level of noise in the market.

By mid-May, the forward-looking focus of investors was squarely set on the expectations associated with the first quarter of 2014. The economic situation in the U.S. was such that it seemed unlikely that the Fed would consider changing its QE programs until that point at the earliest, so stock prices behaved accordingly.

The stock market got a wake up call at 2:42 PM EDT on 19 June 2013. That was nearly the exact moment when Federal Reserve Chairman Ben Bernanke put his voice behind the idea that the Fed would act to reduce its QE efforts before the end of the year if the economy improved as the Fed expected, and perhaps as early as before the end of the third quarter of 2013. Stock prices quickly plunged as a number of investors began making buy and sell decisions based upon the expectations associated with the third quarter of 2013.

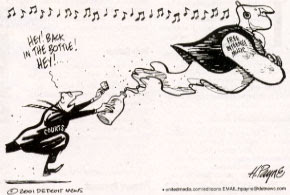
Trying to Get the Genie Back in the Bottle - Source: California Bar Journal

The Fed wasn't ready for that expectation to take hold, since the data for the nation's economic performance wasn't good enough to support that conclusion at that time, so the Fed spend the next month doing everything in its power to put the QE-tapering genie back in its bottle. And they succeeded, which we see in the probability level falling back to the near-zero level.

But then, the nation's economic data began indicating improvement, and combined with the losses the Fed is taking on its balance sheet from buying into the MBS and Treasury markets at and near their respective tops, began providing Fed officials with the incentive to push for an earlier end to QE, even though the nation's economic situation is still such that the change in policy may be premature and heaven forbid that the Fed ever realize a loss on its own books....

Since then, the probability that the Fed would reduce its MBS and Treasury buys rose until it peaked in the last week.

Since we're now less than two weeks away from when the dividend futures contract for the third quarter of 2013 expires, there is little reason for investors to continue dwelling upon when the Fed will actually taper its QE program, especially when it's clear that a consensus has been made. With the time left in the quarter running out, there is too little advantage at this point for investors to even bother with the Fed's short-term plans for QE, unless they're drastically different from what they've indicated would be the case.

Instead, we think that it is more likely that investors will once again shift their forward-looking focus back to the expectations associated with the first quarter of 2014 in deciding what to do with their investment portfolios. If that's the case, based just on the fundamental driver for stock prices, it's a time to buy while stock prices are lower than they will be.

That doesn't consider the effect of new sources of noise that might negatively affect the outlook for investors. With a potential attack on Syria, a potential U.S. government shutdown in October and the potential for the Fed's officials saying or doing something really stupid, just to name a few possibilities being tossed around the news today, there's plenty of noise out there to make investing in the stock market the risky short term affair that it always is.

The key thing to understand about noise however is that it always ends - it is only ever a question of when. And with the immediate future for the Fed's QE program, we're very near the end of its current act.

Senin, 09 September 2013

S&P 500: Shifting Expectations, Shifting Stock Prices

Last week provided a pretty neat example of how changing expectations of dividends that will be paid in the future cause today's stock prices to change in response.

Our first chart shows how the expectations for the equivalent amount of dividends per share for the S&P 500 that are expected to be paid out in the first quarter of 2014 changed from Friday, 23 August 2013 through Wednesday, 4 September 2013 (when we created the following chart), along with the change in the closing value of the S&P 500 index on each day:

Change in Expectations for 2014-Q1 Dividends and Change in S&P 500 Index Value, 23 August 2013 through 4 September 2013

The scaling was automatically selected by Microsoft Excel when we created the chart - we haven't done anything to tweak it.

In looking at the chart, we see that the expectations for future dividends per share changed first on Monday, 26 August 2013, dropping by 11 cents per share, and was proportionately followed a day later by S&P 500 stock prices, which dropped by $33 per share. On Wednesday, 4 September 2013, we see that the expected dividends per share for the quarter suddenly jumped higher, as stock prices followed suit on the same day, but did not jump as high.

That's likely because of the effect of another set of expectations that is currently affecting stock prices. In addition to their fundamental driver of expected future dividends per share, stock prices today are also being greatly affected by investor expectations for the Federal Reserve's current program of quantitative easing.

Here, we observed last week that investors were effectively giving anywhere from a 62% to a 78% probability that the Fed will announce that it will begin purchasing fewer U.S. Treasuries and mortgage-backed securities before the end of the third quarter of 2013. (Note: we believe the actual probability is much closer to the high end of that range - the lower probability is given by one of our sources for expected future dividends per share that was set in place nearly three months ago.)

But when we did the same analysis this week for estimating that likely probability, which we by determining the percentage of the distance between the expectations for dividends are in the relevant future quarters are with respect to with the change in the growth rate of daily S&P 500 stock prices, we find that even though the future expectations for 2014-Q1 changed, investors maintained the nearly the exact same expectations for when the Fed might begin tapering its current QE programs:

Change in Growth Rates of Trailing Year Dividends per Share with Daily and 20-Day Moving Average of S&P 500 Stock Prices, through 6 September 2013

As a result, stock prices maintained the same relative position between the future expectations for dividends per share in 2013-Q3 and 2014-Q1, indicating a 61%-74% probability that the Fed will indeed begin tapering its QE program in 2013-Q3. (Note: We would still say that Schrödinger's Cat is three-quarters dead.)

So, while fundamental expectations of the future changed, expectations related to the Fed's QE program did not. The combination of these factors largely explains and accounts for how and why stock prices as measured by the S&P 500 have changed just as they have since 23 August 2013.

Selasa, 03 September 2013

S&P 500: Odds Suggest Schrödinger's Cat Is Three Quarters Dead

Last week, the stock market gave 52% odds that the Fed would commit to tapering off its purchases of U.S. government-issued securities by the end of the third quarter of 2013. In just a week's time, the probability of that happening have increased to be somewhere between 62% and 78%.

We know that's the case because that's how much the gap between the expectations for dividends associated with the first quarter of 2014, the point in the future where investors had fully fixed their forward-looking focus as recently as mid-June 2013, and the expectations associated with the third quarter of 2013, which is where investors expecting an earlier end to the Fed's QE program would focus, has closed.

The reason we're now indicating a range of potential odds for this likelihood is due to the different information being communicated by our primary sources of data for the dividends that will be paid out in future quarters.

One of those sources effectively stopped transmitting data related to the full amount of dividends that would be paid out during 2013-Q3 after the futures contracts for the dividends of 2013-Q2 were closed out, which happened back on the third Friday of June 2013. At that time, those futures indicated that S&P 500 companies would collectively pay the equivalent of $8.64 per share in cash dividends during the third quarter of 2013.

Our other source of data continued transmitting however, and now indicates that the effective cash dividend per share that will be paid out by S&P 500 companies will be $8.81.

The difference between these two values accounts for the range of probabilities associated with our real-life Schrödinger's Cat experiment with the stock market, which we've indicated by the range on our chart (the upper limit of the range coincides with 2013-Q3 dividends at $8.81 per share, the lower limit coincides with the $8.64 per share value.)

Normally, we wouldn't care because the small difference between the values isn't much different from the levels of noise we typically see in the data, however since we're using the change of the rate of growth of stock prices as the measure of the relative probability that investors are assigning to a particular market-influencing event, we're endeavoring to quantify it as best as possible. Based on what we observe in the trends for other future quarters in the chart, we'd say the odds are much closer to 78% than they are to 62%.

Schrödinger's Cat - Source: lbl.gov

Or in more colorful terms, where the potential of the Fed's earlier end to its current QE program is concerned, investors are increasingly coming to believe that Schrödinger's Cat is over three-quarters dead.

That's a good thing given the math for how stock prices work. The lower probability would coincide with the S&P 500 in September falling off to a value of around 1500 within the next few weeks. Meanwhile, the higher value would be more favorable to investors, since it coincides with the S&P 500 falling to around 1550 during that time.

That assumes that the Fed's pending announcement of the timing it will set for the tapering of its QE program will remain the dominant focus for investors during this time. News, or rather, new noise events, would cause stock prices to deviate from the values set by these rational expectations based on basic market fundamentals.

The potentially very good news in all this is that the focus at this level will not remain there for long, because the futures contracts for dividends related to the third quarter of 2013 will expire on the third Friday of September. And since the first quarter of 2014 is still in the future, investors will therefore have the option of returning their focus to the positive level associated with this point in time after the Fed's announcement of its plans.

The potentially very bad news however is that the alternative future quarters that investors could use to rationally set their forward-looking expectations are considerably more negative in outlook than the quantum level for expectations associated with the third quarter of 2013.

So, let's hope that the Fed provides a good reason for investors to reset their focus on 2014-Q1 after they officially commit to doing whatever it is they will do.

No matter what however, investors will not dwell over the fate of Schrödinger's Cat for very long....

Senin, 26 Agustus 2013

Schrödinger's Cat and the S&P 500

What a boring week!

The week ending on 23 August 2013 was a week in which the Fed's officials very clearly went out of their way to not make any noise as they jetted off to Jackson Hole, Wyoming for their annual retreat. And in the absence of other noise or significant changes in the fundamental outlook for the companies that make up most of the U.S. stock market, the market pretty much ended exactly at the same level it ended in the previous week.

Really! To illustrate the point, we added just two words to our notes on our chart from last week. Actually, just the same word twice "Still":

Change in Growth Rates of Expected Future Trailing Year Dividends per Share with Daily and 20-Day Moving Average of S&P 500 Stock Prices, through 23 August 2013

The biggest market-driving news of the week was the release of the notes from the Fed's 31 July 2013 meeting on Wednesday, 21 August 2013. And because they didn't provide any greater clarity for when the Fed might begin slowing the purchases of U.S. Treasuries and mortgage-backed securities that make up its current quantitative easing scheme, the change in the growth rate of stock prices remained stuck about halfway between the future associated with an earlier slowdown (2013-Q3) and the future associated with a later slowdown (2014-Q1).

It's almost as if the whole last week never happened!

Speaking of the split in the consensus for when the Fed's current QE program will begin to draw down, we wonder if the split in the consensus of the Federal Reserve's Open Market Committee is the same as the split we observe in the expectations for these two potential futures.

There was one item in last week's news that we found noteworthy. It seems an economist from Princeton University has arrived at the same conclusion about the role of the Fed in creating the market turbulence we've seen this summer that we did just a day after the event in question, although it took them over two months to reach that same conclusion and communicate it to Fed officials.

JACKSON HOLE, Wyo.—The Federal Reserve believes that providing clear guidance about the likely future course of its policies make them more effective in boosting the economy, while helping to tamp down on market volatility and uncertainty.

That may not be so, said a paper presented here Saturday by Jean-Pierre Landau of Princeton University at the research conference hosted by the Federal Reserve Bank of Kansas City.

Over the last year, the Fed has been buying $85 billion a month of bonds in an effort to lower long-term interest rates, hoping that will spur growth and lower unemployment. Fed officials have been warning for months since May that they could start scaling back the program if the economy continues to improve as they expect.

The problem for the Fed is that as its policy makers have tried to prepare markets for this shift, they've generated considerable market volatility, in part driving up bond yields and boosting borrowing costs.

But the best part is when the Princeton economist discovers the role of what we've long described as "noise events" in affecting markets:

Mr. Landau lays a lot of the blame for the bond-market turbulence on the Fed itself. The paper notes that current Fed guidance on the policy outlook eliminates the cost of leverage, and creates "strong incentives" to increase and even overextend investment exposures.

In turn, "this makes financial intermediaries very sensitive to 'news,'" whatever that may be, he wrote. In this case, the catalyst for the market tumult is the Fed's statements about possibly scaling back the bond program this year. Once that view was conveyed to markets, it drove a big shift in market positions, to a degree that was very surprising to many observers.

But perhaps not so surprising if you know what expectations for things like stock prices are associated with different points of time in the future. And as we're emphasizing today, for the current "market tumult", it's really just a matter of determining how split investors are between the outlooks that apply for each of those alternative futures.

We'll see how long it takes Princeton's economics department to catch up to that realization. Our guess though is that Princeton's physics department may beat them to it, since this is, after all, the financial equivalent of the many-worlds variant of Schrödinger's Cat experiment....

Previously on Political Calculations

We had looked forward to a boring summer. Instead, we've found ourselves providing the following observations and near real-time analysis of the economic story of the summer, to which the economics department at Princeton University would appear to only just be beginning to catch on....

  • The World Investors and the Fed Live In Now - Our snapshot of the market right before the event, in which we note that investor concern about the future of QE was growing and remark that there will be a market reaction in response to the outcome of the Fed's two-day meeting later that week.

  • The Bernanke Noise Event - as the Summer of 2013 shall ever be known to investors....

  • Now Is It Time to Sell? - according to statistics, a quaint branch of mathematics that only works to describe how stock prices vary with respect to their trend when order is present in the market. The problem with it is that the market goes in and out of order, so it's periodically pretty useless....

  • The Fed's Real QE Mistake: Timing - We explain how Bernanke really screwed up.

  • Now What Will You Do? - the statistical line is crossed! We look at everything that we see screaming "sell", without actually saying it's time to sell.

  • The Fed Attempts to Walk It Back - we anticipate how the Fed will respond to Bernanke's error, and we determine if it will work.

  • The GDP Multiplier for QE - Not about investing, at all! Instead, we explain why sustaining QE at current levels is so important to the U.S. economy at present.

  • "Never Bet Against the Fed" - we visually illustrate that the Fed's response to repairing the damage from Chairman Bernanke's blunder is working and recap why fears of stock market doom, despite signals to the contrary, were really overblown.

  • Bernanke Closes the Gap - we mark the end of the Bernanke Noise Event.

  • The Noise of Summers - we note the beginning of a new negative noise event....

  • The S&P 500 Hits 1700 A Month Late - Finally, after all that noise!

  • The Fed's Minions Shoot Themselves in the Foot - we discuss the role of new data and comments by Fed officials in forcing stock prices off the pace the Fed had previously preferred.

  • How the Timing of the Tapering Is Driving Stock Prices - we apply the kind of analysis that we invented to explain why the market would appear to be split between two very different futures.

The Kind of Analysis That We Invented