Tampilkan postingan dengan label risk. Tampilkan semua postingan

Kamis, 17 Oktober 2013

The Odds of Going to the Hospital

What are the odds that you will need serious medical care?

By "serious medical care", most people will automatically think of a situation where they might need to be admitted to a hospital to receive care for an unforeseen condition, so that's the standard we'll use to answer that question.

Beyond that, we'll break the information down by age and sex, simply because we can see these being major factors that might affect how likely a person will need hospital care.

It turns out to be a really difficult question to answer, because in the U.S., which is where we first sought to get hospital utilization data, tracks hospital discharges - not admissions. The problem with that is that the number of admissions won't necessarily track with the number of discharges, as patients die or perhaps otherwise leave the hospital before being officially discharged.

So we turned elsewhere to answer the question, and specifically to the island nation of Singapore, whose Ministry of Health makes the data not only easy to find, but presents it in a way that helps us answer our specific questions. Our first chart below illustrates the 2011 hospital admission rates by age group and sex per each 1,000 members of Singapore's resident population:

Singapore: 2011 Number of Hospital Admissions per 1,000 Population, (Excludes Normal Deliveries and Legalized Abortions)

One interesting aspect of the data is that we see such high numbers for the 0-4 age group, which drops off dramatically for the 5-9 age group, which really didn't make a whole lot of sense to us at first. Why would a 4-year old have such a dramatically higher probability of being admitted to a hospital over a 5-year old?

We started thinking about it, and realized that the MOH's statisticians gave us a valuable clue - the number of hospital admissions for each 1,000 members of Singapore's resident population doesn't include hospitalizations associated with either normal deliveries for pregnancy or legalized abortions.

While both of these categories would count as foreseeable conditions, we suspect that the reason in the case of normal deliveries was in part to avoid double-counting. Here, where normal deliveries are concerned, we suspect that infants born in Singapore's hospitals are subsequently "admitted" to the hospital after being born, which is how the hospital admissions associated with normal deliveries are tracked.

Beyond that, we can see that the rate of hospital admissions for women of child-bearing age is over twice that of men of the same age, which likely corresponds to pregnancies that involved complicating factors requiring more intensive care, which would not count as a foreseeable condition.

Having worked out why that apparent anomaly exists, we used that knowledge to determine the probability of being admitted to a hospital for both men and women by age, reverse engineering Singapore's age-group based data to approximate the odds by single year of age from Age 0 through Age 84:

Probability of Hospital Admission for Men by Age (Singapore 2011)

Note how nearly 100% of those 0-year olds are admitted to the hospital! Next, let's look at the same data for women from Age 0 to Age 84:

Probability of Hospital Admission for Women by Age (Singapore 2011)

In looking at the differences in the data between men and women, we see that boys are more likely to be admitted to a hospital before Age 4, after which we see that both boys and girls have similar odds up until child-bearing becomes a factor. At that point, women are much more likely to require hospital admission than men (likely for the reasons we noted earlier), up until their mid-forties, after which, men become much more likely to require hospital admission.

The longer lifespan of women with respect to men likely explains that discrepancy, although we were surprised to see how wide that gap was by Age 84, with women having a 50% probability of being admitted to a hospital and men having almost a 90% probability.

References

Singapore Ministry of Health. Hospital Admission Rates* by Age and Sex 2011. [Online Report]. 10 November 2012. Accessed 8 October 2013.


Senin, 30 September 2013

Assessing the Real Risk of a U.S. Debt Default

In our previous analysis of the S&P 500, we indicated that we expected that stock prices might fall in the very near term in response to both profit-taking and the arrival of a new negative noise event associated with the possibility of a partial federal government shutdown in October 2013.

Sure enough, we can say we saw it coming! We'll squeeze just a little bit more information into the current version before we officially revise it to move past the third quarter of 2013 to show how these things have played out:

Change in Growth Rates of Expected Future Trailing Year Dividends per Share with Daily and 20-Day Moving Average of S&P 500 Stock Prices, through 27 September 2013

The profit-taking is pretty easy to understand, as the stock market enjoyed a run up in prices through much of September 2013 in anticipation that the Fed would not cut back on its current quantitative easing programs. But what about the possibility of a new negative noise event?

That's tougher to tell. Here, we're going to start our analysis today by looking at a bit of data being advanced by at least one uncritical left-wing economist that markets believe that the United States is at a sharply increasing risk of defaulting on its national debt.

Here's what the WSJ article he cites says:

President Barack Obama repeated Thursday that he won't negotiate on the debt ceiling and won't sign any bill that defunds or delays the health-care law. He lashed out at Republicans for what he said were moves endangering the full faith and credit of the country. "You don't mess with that," he said in a speech in Largo, Md.

The Congressional Budget Office has estimated that if the debt ceiling isn't raised, the government will be unable to pay all its obligations sometime in late October.

Investors appear to be eyeing the possibility that the issue won't be resolved, judging by the sixfold increase in the past week—to its highest level since 2011—of the annual cost of derivatives some investors use to hedge against the risk the U.S. will default on its debt.

The WSJ's chart shows how the value of the investment derivatives tied to the risk of a U.S. government debt default have changed since July 2013. But this bit of information is why we describe the left-wing economist as being uncritical, because he is taking it at face value without any apparent understanding of what it is really communicating.

Once upon a time, these kind of credit derivatives, or as they are more commonly known, Credit Default Swaps (CDS), were used by investors to hedge against the risk that an entity, say a firm or a sovereign nation, would default on its debt.

Back in 2011, they were very successful in communicating the risk that a number of European nations were increasingly at risk of defaulting on their debts. So much so that the people who run the European Union scapegoated the trading of credit derivatives for the problems of its failing nations and took steps to effectively ban them by starving them of the liquidity they would need to function as a tool that clearly communicates the risk of default.

This is significant because, as you'll note on the WSJ's chart, that risk is denominated in Euros, not U.S. dollars.

As a result of the EU's actions, credit default swaps are no longer capable of communicating the real risk of whether a nation might default on their debt. Reuters explains:

"Sovereign CDS volumes and liquidity are down massively," said Michael Hampden-Turner, credit strategist at Citigroup. "Part of that is because investors are more optimistic about risk generally, but the EU ban has also hurt liquidity."

"The market tends to be fairly one-way round, leaving it vulnerable to gapping spreads when there is activity. Dealers are not prepared to run big positions as there is nowhere to lay the risk off, which makes it worse. Every quarter volumes slide and CDS becomes less liquid, and that looks set to continue."

[...]

This is a marked change from the pre-ban era, when CDS trading would pick up when a sovereign became more stressed and it was viewed as an important pricing point.

So, if these kinds of credit derivatives are no longer effective communicators of the degree of risk that a nation might potentially default on its debt, what is? Reuters answers:

"People pricing sovereign risk now look at the bonds, so why would you look at the CDS if bonds are where the information lies? Back in the day it was the other way around, with CDS levels being the crucial signal - it's a fundamental change," said Paul McNamara, investment director at GAM.

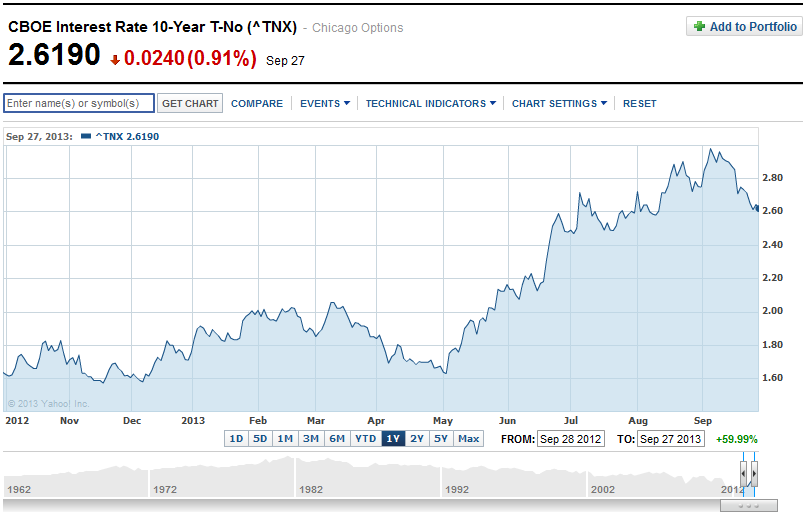
So, let's look at the yields of U.S. government-issued bonds. Here, if the risk of the U.S. government really defaulting upon its debt had really increased, we would see a spike in bond yields - the interest rates that the U.S. government pays to its lenders. Our first chart shows the yield for the benchmark 10-Year U.S. Treasury for the past year through 27 September 2013:

10-Year U.S. Treasury Yield - Source: Yahoo! Finance

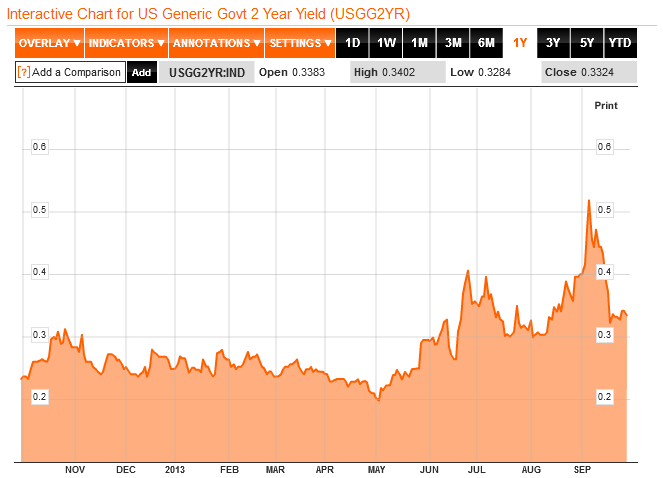
Let's next look at a shorter term bond - the 2-Year U.S. Treasury, which might show a more pronounced response to the near term risk of a U.S. default:

2-Year U.S. Treasury Yield - Source: Bloomberg

It doesn't do us much good to look at shorter-term U.S. Treasuries, because the Federal Reserve's Quantitative Easing (QE) program has pushed their yields down to near-zero levels. This outcome is specifically the result of what we describe as QE 4.0, which is the portion of the Fed's current QE programs that buys up U.S. Treasuries. QE 4.0 was announced back on 12 December 2012 to offset the imminent risk of a sharp contraction in the U.S. economy resulting from President Obama's desired tax hikes going into effect in 2013, and it has largely succeeded in keeping the U.S. economy out of a full-fledged recession.

In both these charts, we see the effect of the risk of the Fed cutting back on its purchases of U.S. Treasuries through its QE programs. From the beginning of May 2013, the yield on U.S. Treasuries rose in direct response to the likelihood that the Fed would begin tapering as early as September 2013, which was largely based on the perception of a strengthening U.S. economy. That probability peaked in early September, after which it became clearer that the Fed was less likely to act to taper its QE programs in September as the economy isn't recovering from being in microrecession as strongly as some data would indicate.

Stock Market Chaos Through this period, both President Obama and the U.S. Treasury Secretary Jack Lew have made statements indicating that they would refuse to negotiate with congressional leaders to avoid a government shutdown or a default on the U.S. national debt, which they targeted to occur in mid-October 2013. The yields of U.S. Treasuries did not react meaningfully to their statements as we should expect if markets really believed that the risk of a U.S. default had increased.

Their most recent statements came on Friday, 27 September 2013, once again emphasizing that President Obama would refuse to negotiate to avoid either a debt default or a partial shutdown of federal government operations. The yields for both the 2-Year and 10-Year U.S. Treasuries declined in response. If President Obama's claims had more credibility, yields on U.S. Treasuries would have risen in response.

But the spreads of the very lightly-traded CDS spreads for U.S. sovereign debt did, suddenly, within the last week - a jump so pronounced in the absence of any confirmation of a similar change in the yields of U.S. Treasuries that it is most likely attributable to a very small change the trading volume for it.

That kind of volatility is often a characteristic of low-volume trading activity in a market with low liquidity. It simply doesn't take very much money to create significant price changes.

It's kind of like how Intrade's prediction market for the 2012 U.S. Presidential election outcome was briefly manipulated to favor Mitt Romney following one of the presidential debates, only here, the manipulator of the market for U.S.' sovereign credit default swaps would appear to find President Obama's statements and policies to be credible.

The good news, if you can call it that, is that because of that fact, we know it wasn't the Russians, Iranians or Syrians. In this day and age, you have to take the good news where you can find it!

Kamis, 26 September 2013

Obamacare and Trader Joe's: The Rest of the Story

We said that there was more to the story of Trader Joe's decision to dump its part-time employees into ObamaCare, and there is. What follows is our analysis of the statement that Trader Joe's provided to the Washington Post's Wonkblog over a week and a half ago, for which we're apparently the first media organization to produce any sort of serious analysis. We'll start at the top:

Thank you for writing to us. It's possible you have been misled, at least to some degree, by the headlines in some articles regarding our reasons for implementing the [Affordable Care Act] in January. We'd like to take this opportunity to clarify some facts.

For over 77% of our Crew Members there is absolutely no change to their healthcare coverage provided by Trader Joe's.

In January 2012, Trader Joe's was estimated to have approximately 5,500 employees nationwide, working at 365 stores, with half of these situated in the state of California. Today, we would estimate that figure is over 5,700, as the privately-held grocery store chain now has at least 380 locations.

According to the company's statement, of those estimated 5,700 employees, 23% are part-time employees that Trader Joe's will drop from their employer-provided health insurance program, which works out to be over 1,300 employees that will be affected by the change.

The ACA brings a new potential player into the arena for the acquisition of health care. Stated quite simply, the law is centered on providing low cost options to people who do not make a lot of money. Somewhat by definition, the law provides those people a pretty good deal for insurance ... a deal that can't be matched by us -- or any company. However, an individual employee (we call them Crew Member) is only able to receive the tax credit from the exchanges under the act if we do not offer them insurance under our company plan.

Since half of the company's employees are based in California, we can see just how "affordable" their insurance coverage will be after they are forced out of Trader Joe's employer-provided health insurance plans into the plans that will typically be available in that state. The table below reveals what we found when we used UC-Berkeley's "How Much Will a Family Save Under the New Federal Health Law? California Calculator" application to approximately determine what a single adult or a single adult parent with one child will have to pay for health insurance on the state's exchange:


Estimated Full Cost of Monthly Premium for Second-Least Expensive "Silver" Health Insurance Plan in California in 2014
Household Description Age 21 Age 25 Age 30 Age 35
Single Adult $230 $231 $261 $281
One Adult, One Child (Under Age 21) $376 $377 $407 $427
Source: University of California at Berkeley Labor Center

California's "Silver" plans are intended to cover roughly 70% of the health care expenses for the individual or family covered by the plan will have, with the remaining 30% of the costs being paid for by the insured. But that's after paying the premiums for the plan, the full cost of which would run anywhere from a minimum of $2,760 per year for a single, 21-year-old individual with no children to $5,124 per year for a 35-year-old single parent with just one child.

We know from a previous example that we considered that Trader Joe's employer-provided health insurance policies are much closer to what would qualify as being a "Gold"-level plan on the new exchanges being established under the Patient Protection and Affordable Care Act, which would cover roughly 80% of the costs for health care incurred by the insured. The costs associated with the "Silver" plans that we've listed above would therefore represent a downgrade in the quality of coverage, even though they would be considered to be more affordable because they cost less than what a "Gold"-level plan would cost. Basically, the savings result because you pay less to get less.

These numbers don't consider the role that the new ObamaCare subsidy tax credits might play in reducing the out-of-pocket costs that would be paid by Trader Joe's employees, but we'll need to know how much they earn to be able to approximate what their actual out-of-pocket costs for insurance will be after being kicked out of Trader Joe's employee plan into California's ObamaCare health insurance marketplaces.

Fortunately for us, Trader Joe's provided just such an example.

Perhaps an example will help. A Crew Member called in the other day and was quite unhappy that she was being dropped from our coverage unless she worked more hours. She is a single mom with one child who makes $18 per hour and works about 25 hours per week. We ran the numbers for her. She currently pays $166.50 per month for her coverage with Trader Joe's. Because of the tax credits under the ACA she can go to an exchange and purchase insurance that is almost identical to our plan for $69.59 per month. Accordingly, by going to the exchange she will save $1,175 each year ... and that is before counting the $500 we will give her in January.

Let's do some relevant math to get some insight into what's going on here:

  • Assuming the single mother, parent of one child, works 52 weeks per year, at a wage of $18 per hour and working 25 hours per week, she will earn $23,400 in a year.

  • Trader Joe's claims she has been paying $166.50 per month, or $1,998 per year, for health insurance through the company's health insurance program, which covers both herself and her child.

  • If she buys insurance on California's ObamaCare exchange, Trader Joe's claims she will only pay $69.59 out of pocket each month, which works out to be $835.08 per year.

  • The difference between $1,998 per year and $835.08 per year is $1,162.92, which would be the actual annual "savings" that she would have if Trader Joe's accurately represented these figures.

Trader Joe's states that the savings would be $1,175 per year, which is off by $12.08. That doesn't sound like much, but it was enough to get us to dig deeper into their numbers.

Using the tool we originally developed to determine whether it would be better to buy health insurance on your state's ObamaCare exchange or to pay the ObamaCare income tax instead, we reverse-engineered Trader Joe's numbers. Here's the adapted version of the tool with the relevant numbers so you can see what we found:


Your Household Data
Input Data Values
Your Total Household Income, or Modified Adjusted Gross Income (If Known)
Number of Household Members
Number of Children in Household
Your State's Health Insurance Exchange Data
Select Your State (Select "United States" If Your Territory Isn't Listed)
Monthly Premium for the Second Lowest-Cost "Silver" Plan Available To You
Monthly Premium for the Health Insurance Plan You're Considering Purchasing


Your Annual Health Insurance Results
Calculated Results Values
Annual Premium (Full Price) of the Health Insurance Plan You're Considering Purchasing
Annual Subsidy Tax Credit You'll Receive For Buying This Health Insurance
Your Annual Out-of-Pocket Cost
For Health Insurance (Premium Only, No Co-Pays or Deductibles)

Since the $377 figure in our tool represents the estimated second-lowest cost for a "Silver" plan for a 25-year year old single mother with one child, it appears that Trader Joe's would have their employee enroll in what the price for the monthly premium for the health insurance plan being considered suggests is the lowest-cost "Silver" plan for health insurance, which appears to run $367.81 per month.

Obamacare-Driven Greed - Source: sanders.senate.gov

Once again, since we've already established that the coverage of Trader Joe's employer-provided plan is more akin to a "Gold"-level plan in the new ObamaCare exchanges, this represents a downgrade in the quality of the single mother's health insurance coverage.

If the employee were willing to continue paying the same $166.50 per month, or $1,998 per year, for health insurance that she is today for a "Gold" or perhaps even a "Platinum"-level plan on California's ObamaCare exchange, she could afford a plan with a premium of $464.72 per month, or $5,576.64 per year, which would be more equivalent to the level of coverage she had through the plan that Trader Joe's previously provided to her family.

As such, we can work out how much Trader Joe's stands to gain from dumping their single mother employee onto the ObamaCare health insurance marketplaces. Here, assuming that our estimated ObamaCare "Gold" or "Platinum" health insurance cost is close in value to the full cost of the policy that Trader Joe's provides today for this particular employee, we find that since the employee is contributing $1,998 toward the cost of their health insurance premium, Trader Joe's must be paying about 64.2% of the full cost of the health insurance toward her family's coverage, or $3,578.64. Multiply a number like that by 1,300 part-time employees being dropped from good health insurance coverage into ObamaCare, and suddenly, we're talking about millions of dollars worth of reduced costs and savings for the company.

This is why Trader Joe's is able to provide the part-time employees that it's ousting from its employer-provided health insurance plans with $500 each. In reality, they would be reducing their costs and increasing the company's annual profit by $3,078.64, and that's just from dumping this single employee onto the ObamaCare exchange in California.

Let's resume going through Trader Joe's statement to the media:

While we understand her fear of change, at her income level this is a big benefit that we will help her achieve.

Hopefully, she won't recognize that in gaining this "big benefit" as Trader Joe's would have her do, she's putting herself into a situation where she has health insurance coverage of lesser quality than she did before, putting her at risk of higher out-of-pocket expenses.

Clearly, there are others who will go to the exchanges and will be required to pay more. That is usually because they have other income and typically a spouse who had a job with no benefits and they do not qualify for the subsidies under the ACA.

One example of that we had yesterday was the male Crew Member who worked an average of 20 hours per week but had a spouse who is a contract consultant who makes more than $200,000 per year. The Crew Member worked for the medical benefits and unfortunately for them they are likely to have to pay more because of their real income. We understand how important healthcare coverage is to our Crew Members and we are pleased to be able to provide and support this program.

Does this means that in addition to greedily profiting from pushing their part-time employees into lower quality health insurance by selling them on the phony "big benefits" they'll get if they do, they also oppose the idea of any of their employees being married to people who also work in jobs that don't provide the generous benefits that Trader Joe's has previously sought to provide, but would now appear to believe are too generous?

We do hope this information helps, and we appreciate your interest in Trader Joe's.

It helped quite a bit actually. It tells us exactly what Trader Joe's principles and priorities were and will be with respect to their employees, given the perverse incentives created for the company by the Obamacare law.

We must remember that before the law's provisions kicked in, the company was very willing to provide very generous benefits to all of its employees. We're just starting to find out how the law has changed their perspective on the value of their crew members so much that they're now willing to kick 23% of them to the curb. The company is being compelled by President Obama's Patient Protection and Affordable Care Act to break the trust they worked hard to build with their crew members.

And that's perhaps the biggest problem with Obamacare. ObamaCare breaks trust.

References

University of California at Berkeley Labor Center. How Much Will a Family Save Under the New Federal Health Law? California Calculator. [Online Application]. May 2013. Accessed 23 September 2013.

Oakner, Larry. Trader Joe's: The Chicken or the Egg? [Online Article]. CoreBrand. 10 January 2012. Accessed 23 September 2013.

Kliff, Sarah. Trader Joe's cut health benefits last week. Here's its side of the story. [Online Article]. Washington Post. 16 September 2013. Accessed 23 September 2013.


Selasa, 24 September 2013

Obamacare and Trader Joe's: An Economic Detective Story

Trader Joe's storefront - Source: sanjoseca.gov/index.aspx?NID=3223

Last week, we introduced our tool that can help you choose which option is financially better for you: buying an Obamacare insurance plan in your state or paying the Obamacare income tax. When we did, we hinted that there was more to the story regarding the default values that we entered into our tool, and today we're following up that story: they are the numbers that apply to a young woman who just found out that her employer, Trader Joe's, is going to drop her and a large number of other part time employees from the company's health insurance program for employees.

Owned by Germany's Albrecht family, who also own the German-based Aldi international grocery store corporation, Trader Joe's previously had the reputation of providing above-market compensation and benefits for its employees, where it traded higher labor costs for higher productivity and lower employee turnover-related expenses for the firm.

Here are a number of key excerpts from the anonymous woman's story, which came out in response to a memo that the company issued to its staff on 30 August 2013:

A current Trader Joe's worker described the coverage she'll likely lose as "one of the best parts about the job." (The employee requested anonymity since she isn't authorized to speak to the media.) She said she pays only $35 per paycheck, or $70 per month, for a plan that generally covers 80 percent of her medical costs, carries a reasonable $500 deductible and includes prescription drug coverage.

"There are several folks I work with who are there for the insurance as much as anything, mostly folks with young families," she said. "I can say that when I opened and read the letter yesterday my reaction was pure panic, followed quickly by anger."

The employee said she averages about 28 hours per week and worries she won't make the cutoff for company-based coverage. Whether workers hit the 30-hour threshold and become eligible for the company plan will be determined by their work schedules over the course of the next three months, the memo explains. For those who may be on the cusp, the memo left little hope that they can pack in extra hours to meet the requirement.

"It is important to note ... we do not create our weekly schedules with healthcare eligibility in mind," Bane wrote. "Rather, we will continue to create weekly schedules that are solely focused on supporting the customer experience."

The worker, who took home less than $20,000 last year, might be able to find a similar plan at a comparable cost under Obamacare, judging from a subsidy calculator. But there's no guarantee, other than uncertainty.

Here's what we can work out from the information presented in the article with some straightforward economic detective work. The employee is relatively young and single, which we can determine from the relatively low values she provide for what she pays for her current health insurance coverage.

Typical Percentage of Health Expenses Covered by PPACA 'Metal' Plans

That employee benefit was very generous. Her health insurance plan was roughly equivalent to what would be considered to be the "Gold" level plans that are now being marketed through the new state health insurance marketplaces, which we can deduce from the fact that she indicates that it covers approximately 80% of her health care costs. While those plans would typically not have a deductible, she indicates that her deductible is $500, which is about one-fourth what would be typical for the next-lower tier "Silver" plan available through the state health insurance exchanges.

At $35 per paycheck, her annual out-of-pocket cost for her portion of the premiums that she pays for near-equivalent Gold plan is $910, assuming that she is paid on a biweekly basis. The article does not provide enough information to determine the full actual cost of her health insurance premiums.

The article also provides critical information about her income. It indicates she earns "under $20,000" per year, working an average of 28 hours per week. Assuming that she works 52 weeks per year, that would put her hourly wage at less than $13.74 per hour. For our purposes, we'll assume she actually earns $13.70 per hour, which would give her an annual income of $19,947.20, which is just "under $20,000".

Next, we'll consider what her health insurance costs might be if she chooses to buy a health insurance plan through her state's ObamaCare exchange. Since nearly half of all of Trader Joe's stores are located in California, we'll use that state's exchange information. That's where our assumption that she is relatively young comes into play, as the data we'll use in our tool is take from Covered California's average statewide rates that will apply for a 21-year old in that state in 2014.

Covered California 2014 Average Statewide Rates for 21-Year Old

In the chart above, the top value listed for each income level represents the "typical" out-of-pocket potion of the average monthly premium for each plan, while the lower green value that's listed represents the average subsidy that a single individual might receive, which is based upon the cost of the second-least expensive "Silver" plan. Adding the two values together gives us the full actual cost of an average health insurance premium for a 21-year old in California.

We'll use the cost differences between the "Bronze" plans listed in the chart above, where approximately 60% of the insured's health insurance costs are covered under the plan and the "Silver" plans, which cover around 70% of the insured's health care expenses, to estimate what the near-equivalent "Gold" plan would cost her. Taking the average of the second-least and third-least expensive plans listed, we estimate the typical average monthly cost of a "Gold" plan in California would be $283.

With all that data then, we can now establish what the real financial choice that will soon be faced by Trader Joe's part-time employee in the tool below. We'll find out how much she'll have to pay for health insurance plan that's nearly equivalent to the one that Trader Joe's is taking away from her, and whether she would simply be better off paying the tax, and only buying the insurance if and when she actually needs it.


Your Household Data
Input Data Values
Your Total Household Income, or Modified Adjusted Gross Income (If Known)
Number of Household Members
Number of Children in Household
Your State's Health Insurance Exchange Data
Select Your State (Select "United States" If Your Territory Isn't Listed)
Monthly Premium for the Second Lowest-Cost "Silver" Plan Available To You
Monthly Premium for the Lowest-Cost "Bronze" Plan Available To You
Monthly Premium for the Health Insurance Plan You're Considering Purchasing


Your Annual Health Insurance Results
Calculated Results Values
Annual Premium (Full Price) of the Health Insurance Plan You're Considering Purchasing
Annual Subsidy Tax Credit You'll Receive For Buying This Health Insurance
Your Annual Out-of-Pocket Costs
For Health Insurance (Premium Only, No Co-Pays or Deductibles)
For the Alternative Tax If You Don't Purchase Health Insurance (And Not Provided by Your Employer)
Potential Savings or Costs If You Choose to Pay the Tax Instead of the Premium
Your Potential Savings (or Costs, if Negative)
The Bottom Line

For the default values we've entered in the tool above, which doesn't factor in Trader Joe's $500 "go-away" payment, we find that if our heroine can reasonably expect to be healthy, it will be much less costly for her to hold off on buying any health insurance until she might actually need it and pay the additional tax on her income instead, as she will come out ahead by $1,551.01 per year. [Update: There was a small glitch in our original calculation - now fixed (HT: Sean Parnell)!]

We also find that she comes out behind if she chooses to buy into a health insurance plan in California that's nearly equivalent to what her previous employer-provided health insurance coverage was. At her $19,947.20 annual income, she could expect to pay $1,650.48 per year out of her own pocket for the "Gold" level plan that is most nearly equivalent to the coverage that Trader Joe's was previously providing her with an out-of-pocket cost to her of $910, which leaves her some $740.48 in the hole, even after she collects ObamaCare's subsidy tax credit.

Even with Trader Joe's promised extra check for $500, she would still find herself at least $240.48 in the hole compared to today, unless she accepts lesser health insurance coverage that requires her to pay a much larger percentage of her health care costs. And it only gets worse if we account for that extra $500 payment to our heroine's income, because it reduces her ObamaCare subsidy, but we'll leave that for you discover for yourself in our tool above.

The bottom line is that this is a clear example of a case where an individual is both not going to be able to keep the plan they have today where they also come out worse off than they were before, whether through being forced into lesser insurance coverage or through having less disposable income after taxes and health insurance costs.

Looking at Trader Joe's motives in dropping the health insurance it was providing to its part-time crew members, if our estimated full annual cost of $3,396 for a "Gold" plan in California's ObamaCare health insurance exchanges is a good indication of what the company was spending per employee to provide that coverage, reducing that figure by the $910 that the part-time employee was paying per year means that the company stands to reduce its costs for health insurance by $2,496 per previously-covered part-time employee before its $500 "don't bother us" payment, and $1,996 per previously-covered employee after it.

There's still more to the story, as Trader Joe's has both taken heat in the media and responded to the criticism that it has received for dumping its part-time employees out of its health insurance coverage program, but we'll cover that in an upcoming post.

References

Covered California. Health Plans & Rates for 2014: Making the Individual Market in California Affordable. [PDF Document]. 23 May 2013. Accessed 21 September 2013.

HealthPocket. Obamacare Metal Plans. [Online article]. 1 June 2013. Accessed 21 September 2013.


Rabu, 18 September 2013

ObamaCare: Will Making a Little More Income Cost You Thousands?

Mousetrap Baited with Cash - Source: http://ag.ky.gov/civil/consumerprotection/scams/Pages/default.aspx

Yesterday, in launching the first tool that's specifically designed to help you determine if it is better to pay the ObamaCare income tax rather than health insurance using cost information that you obtain directly from your state's health insurance marketplaces, we made an offhand comment about some of the validation testing we did:

Our tool turns out to be surprisingly accurate - although it's not designed to do so, we've validated the "loss-of-subsidy" effect on the out-of-pocket cost of health insurance for making one penny more than ObamaCare's subsidy eligibility level that CNBC described here...

What is the "loss-of-subsidy" effect? It's really a marginal tax rate effect. For people who choose to buy health insurance in the age of ObamaCare, it is the unexpectedly large price they would pay for losing the tax credit subsidy that might make health insurance more affordable if they should find themselves making just a little extra income in a given year than they expected, crossing a critical threshold where they stop being eligible to benefit from the subsidy tax credit.

The really perverse thing is that it doesn't matter where the extra income might come from. You or someone else in your household might get a raise, or a bonus, or a new job, et cetera. Normally, these things would be considered to be good things. Or at least they would be in a sane world.

But in the new age of ObamaCare, perhaps not so much. You might come to believe that little extra money you might otherwise choose to make to make your household better off is really radioactive.

And while our previous tool was designed to answer a different question, we've adapted the math to specifically answer the question of whether you might pay a very large price if you make the mistake of bringing home just a little more bacon.

Our new tool lets you take factors into account so you can find out just how at risk your household might be. Just enter the indicated information in the tool below (if you're reading this article on a site that republishes our RSS news feed, please click here to access a working version of the tool) - we'll work out how what you might have to pay to have health insurance might change....


Your Household Data
Input Data Values
Your Current Total Household Income, or Modified Adjusted Gross Income (If Known)
Percentage by Which Your Household Income Might Increase (Such as if you earned a raise.)
Fixed Amount by Which Your Household Income Might Increase (Such as if you get a bonus.)
Number of Household Members
Your State's Health Insurance Exchange Data
Select Your State (Select "United States" If Your Territory Isn't Listed)
Monthly Premium for the Second Lowest-Cost "Silver" Plan Available To You
Monthly Premium for the Health Insurance Plan You're Considering Purchasing


Are You Negatively Affected by ObamaCare's Subsidy Limits?
Calculated Results At Current Income At a Higher Income Change from Current Income
Household Income
Health Insurance Premium
Tax Credit Subsidy
Your Out of Pocket Cost

In doing this analysis, we find that there are two key thresholds where things go haywire for the American households that will be affected by this perverse phenomenon written into the Patient Protection and Affordable Care Act. The first comes for low income earning households who might find themselves no longer eligible for health insurance coverage through their state's Medicaid welfare program.

2013 Federal Poverty Guidelines, 48 Continuous States - Source: Tucson Citizen - http://tucsoncitizen.com/obamacare-news/2013/05/28/obamacare-help-and-the-federal-poverty-level/

The second is for those households that whose income might exceed the threshold set for middle-class income earners with household incomes greater than 400% of the federal poverty limit. The default data in our tool above applies to this second case.

The big driver in this however is the size of the household. For 2014, for the lower 48 states, the income thresholds are either the 100% or 133% level indicated in the table we've excerpted from the Tucson Citizen, and also the 400% level for middle-class households. (And because of how the law is set up, the 133% level is actually the 138% level, so if your state has acted to expand its Medicaid welfare program under the PPACA, multiply the 100% values in the table by 1.38. If not, use the 100% figures.)

Regardless, households who find themselves just below these margins will be faced with some really perverse incentives to avoid doing anything to earn any extra income, unless they can earn a lot of extra income to more than compensate for the tax credit subsidy that they will lose.

It's the same perverse incentive that works to trap people into welfare programs for life. Only now, in the new age of ObamaCare, the politicians behind the law are out to trap the middle class in their snare.