Tampilkan postingan dengan label business. Tampilkan semua postingan

Kamis, 26 September 2013

Obamacare and Trader Joe's: The Rest of the Story

We said that there was more to the story of Trader Joe's decision to dump its part-time employees into ObamaCare, and there is. What follows is our analysis of the statement that Trader Joe's provided to the Washington Post's Wonkblog over a week and a half ago, for which we're apparently the first media organization to produce any sort of serious analysis. We'll start at the top:

Thank you for writing to us. It's possible you have been misled, at least to some degree, by the headlines in some articles regarding our reasons for implementing the [Affordable Care Act] in January. We'd like to take this opportunity to clarify some facts.

For over 77% of our Crew Members there is absolutely no change to their healthcare coverage provided by Trader Joe's.

In January 2012, Trader Joe's was estimated to have approximately 5,500 employees nationwide, working at 365 stores, with half of these situated in the state of California. Today, we would estimate that figure is over 5,700, as the privately-held grocery store chain now has at least 380 locations.

According to the company's statement, of those estimated 5,700 employees, 23% are part-time employees that Trader Joe's will drop from their employer-provided health insurance program, which works out to be over 1,300 employees that will be affected by the change.

The ACA brings a new potential player into the arena for the acquisition of health care. Stated quite simply, the law is centered on providing low cost options to people who do not make a lot of money. Somewhat by definition, the law provides those people a pretty good deal for insurance ... a deal that can't be matched by us -- or any company. However, an individual employee (we call them Crew Member) is only able to receive the tax credit from the exchanges under the act if we do not offer them insurance under our company plan.

Since half of the company's employees are based in California, we can see just how "affordable" their insurance coverage will be after they are forced out of Trader Joe's employer-provided health insurance plans into the plans that will typically be available in that state. The table below reveals what we found when we used UC-Berkeley's "How Much Will a Family Save Under the New Federal Health Law? California Calculator" application to approximately determine what a single adult or a single adult parent with one child will have to pay for health insurance on the state's exchange:


Estimated Full Cost of Monthly Premium for Second-Least Expensive "Silver" Health Insurance Plan in California in 2014
Household Description Age 21 Age 25 Age 30 Age 35
Single Adult $230 $231 $261 $281
One Adult, One Child (Under Age 21) $376 $377 $407 $427
Source: University of California at Berkeley Labor Center

California's "Silver" plans are intended to cover roughly 70% of the health care expenses for the individual or family covered by the plan will have, with the remaining 30% of the costs being paid for by the insured. But that's after paying the premiums for the plan, the full cost of which would run anywhere from a minimum of $2,760 per year for a single, 21-year-old individual with no children to $5,124 per year for a 35-year-old single parent with just one child.

We know from a previous example that we considered that Trader Joe's employer-provided health insurance policies are much closer to what would qualify as being a "Gold"-level plan on the new exchanges being established under the Patient Protection and Affordable Care Act, which would cover roughly 80% of the costs for health care incurred by the insured. The costs associated with the "Silver" plans that we've listed above would therefore represent a downgrade in the quality of coverage, even though they would be considered to be more affordable because they cost less than what a "Gold"-level plan would cost. Basically, the savings result because you pay less to get less.

These numbers don't consider the role that the new ObamaCare subsidy tax credits might play in reducing the out-of-pocket costs that would be paid by Trader Joe's employees, but we'll need to know how much they earn to be able to approximate what their actual out-of-pocket costs for insurance will be after being kicked out of Trader Joe's employee plan into California's ObamaCare health insurance marketplaces.

Fortunately for us, Trader Joe's provided just such an example.

Perhaps an example will help. A Crew Member called in the other day and was quite unhappy that she was being dropped from our coverage unless she worked more hours. She is a single mom with one child who makes $18 per hour and works about 25 hours per week. We ran the numbers for her. She currently pays $166.50 per month for her coverage with Trader Joe's. Because of the tax credits under the ACA she can go to an exchange and purchase insurance that is almost identical to our plan for $69.59 per month. Accordingly, by going to the exchange she will save $1,175 each year ... and that is before counting the $500 we will give her in January.

Let's do some relevant math to get some insight into what's going on here:

  • Assuming the single mother, parent of one child, works 52 weeks per year, at a wage of $18 per hour and working 25 hours per week, she will earn $23,400 in a year.

  • Trader Joe's claims she has been paying $166.50 per month, or $1,998 per year, for health insurance through the company's health insurance program, which covers both herself and her child.

  • If she buys insurance on California's ObamaCare exchange, Trader Joe's claims she will only pay $69.59 out of pocket each month, which works out to be $835.08 per year.

  • The difference between $1,998 per year and $835.08 per year is $1,162.92, which would be the actual annual "savings" that she would have if Trader Joe's accurately represented these figures.

Trader Joe's states that the savings would be $1,175 per year, which is off by $12.08. That doesn't sound like much, but it was enough to get us to dig deeper into their numbers.

Using the tool we originally developed to determine whether it would be better to buy health insurance on your state's ObamaCare exchange or to pay the ObamaCare income tax instead, we reverse-engineered Trader Joe's numbers. Here's the adapted version of the tool with the relevant numbers so you can see what we found:


Your Household Data
Input Data Values
Your Total Household Income, or Modified Adjusted Gross Income (If Known)
Number of Household Members
Number of Children in Household
Your State's Health Insurance Exchange Data
Select Your State (Select "United States" If Your Territory Isn't Listed)
Monthly Premium for the Second Lowest-Cost "Silver" Plan Available To You
Monthly Premium for the Health Insurance Plan You're Considering Purchasing


Your Annual Health Insurance Results
Calculated Results Values
Annual Premium (Full Price) of the Health Insurance Plan You're Considering Purchasing
Annual Subsidy Tax Credit You'll Receive For Buying This Health Insurance
Your Annual Out-of-Pocket Cost
For Health Insurance (Premium Only, No Co-Pays or Deductibles)

Since the $377 figure in our tool represents the estimated second-lowest cost for a "Silver" plan for a 25-year year old single mother with one child, it appears that Trader Joe's would have their employee enroll in what the price for the monthly premium for the health insurance plan being considered suggests is the lowest-cost "Silver" plan for health insurance, which appears to run $367.81 per month.

Obamacare-Driven Greed - Source: sanders.senate.gov

Once again, since we've already established that the coverage of Trader Joe's employer-provided plan is more akin to a "Gold"-level plan in the new ObamaCare exchanges, this represents a downgrade in the quality of the single mother's health insurance coverage.

If the employee were willing to continue paying the same $166.50 per month, or $1,998 per year, for health insurance that she is today for a "Gold" or perhaps even a "Platinum"-level plan on California's ObamaCare exchange, she could afford a plan with a premium of $464.72 per month, or $5,576.64 per year, which would be more equivalent to the level of coverage she had through the plan that Trader Joe's previously provided to her family.

As such, we can work out how much Trader Joe's stands to gain from dumping their single mother employee onto the ObamaCare health insurance marketplaces. Here, assuming that our estimated ObamaCare "Gold" or "Platinum" health insurance cost is close in value to the full cost of the policy that Trader Joe's provides today for this particular employee, we find that since the employee is contributing $1,998 toward the cost of their health insurance premium, Trader Joe's must be paying about 64.2% of the full cost of the health insurance toward her family's coverage, or $3,578.64. Multiply a number like that by 1,300 part-time employees being dropped from good health insurance coverage into ObamaCare, and suddenly, we're talking about millions of dollars worth of reduced costs and savings for the company.

This is why Trader Joe's is able to provide the part-time employees that it's ousting from its employer-provided health insurance plans with $500 each. In reality, they would be reducing their costs and increasing the company's annual profit by $3,078.64, and that's just from dumping this single employee onto the ObamaCare exchange in California.

Let's resume going through Trader Joe's statement to the media:

While we understand her fear of change, at her income level this is a big benefit that we will help her achieve.

Hopefully, she won't recognize that in gaining this "big benefit" as Trader Joe's would have her do, she's putting herself into a situation where she has health insurance coverage of lesser quality than she did before, putting her at risk of higher out-of-pocket expenses.

Clearly, there are others who will go to the exchanges and will be required to pay more. That is usually because they have other income and typically a spouse who had a job with no benefits and they do not qualify for the subsidies under the ACA.

One example of that we had yesterday was the male Crew Member who worked an average of 20 hours per week but had a spouse who is a contract consultant who makes more than $200,000 per year. The Crew Member worked for the medical benefits and unfortunately for them they are likely to have to pay more because of their real income. We understand how important healthcare coverage is to our Crew Members and we are pleased to be able to provide and support this program.

Does this means that in addition to greedily profiting from pushing their part-time employees into lower quality health insurance by selling them on the phony "big benefits" they'll get if they do, they also oppose the idea of any of their employees being married to people who also work in jobs that don't provide the generous benefits that Trader Joe's has previously sought to provide, but would now appear to believe are too generous?

We do hope this information helps, and we appreciate your interest in Trader Joe's.

It helped quite a bit actually. It tells us exactly what Trader Joe's principles and priorities were and will be with respect to their employees, given the perverse incentives created for the company by the Obamacare law.

We must remember that before the law's provisions kicked in, the company was very willing to provide very generous benefits to all of its employees. We're just starting to find out how the law has changed their perspective on the value of their crew members so much that they're now willing to kick 23% of them to the curb. The company is being compelled by President Obama's Patient Protection and Affordable Care Act to break the trust they worked hard to build with their crew members.

And that's perhaps the biggest problem with Obamacare. ObamaCare breaks trust.

References

University of California at Berkeley Labor Center. How Much Will a Family Save Under the New Federal Health Law? California Calculator. [Online Application]. May 2013. Accessed 23 September 2013.

Oakner, Larry. Trader Joe's: The Chicken or the Egg? [Online Article]. CoreBrand. 10 January 2012. Accessed 23 September 2013.

Kliff, Sarah. Trader Joe's cut health benefits last week. Here's its side of the story. [Online Article]. Washington Post. 16 September 2013. Accessed 23 September 2013.


Kamis, 22 Agustus 2013

The Relative Productivity of Private vs Public Sector Employees

"How does the compensation of federal civilian employees compare with that of employees in the private sector?" is a question that the Congressional Budget Office once asked and answered, finding that the combined cash income and benefits that Uncle Sam's employees are paid is a lot more generous than what their peers in the private sector earn, even after controlling for factors like education, years of experience and job descriptions.

But we wondered how does the productivity of federal civilian employees compare with that of employees in the private sector? After all, if a civilian employee of the U.S. federal government is more productive than their similarly educated and experienced peer doing the same or similar job in the private sector, that difference could well justify their more generous compensation. If everything else is equal, it makes sense that a person who is more economically productive in doing a job would be compensated more than a less productive person doing the same work.

Thanks to a natural experiment, we're about to find out just how productive federal bureaucrats really are with respect to their direct peers in the private sector!

This summer, as part of the cost-cutting measures related to the budget sequester required by the Budget Control Act of 2011, President Obama acted to discontinue the operations of the Department of Labor's International Labor Comparisons (ILC) program, which converts the economic statistics produced by other nations' governments to adhere to U.S. standards and definitions, which allows for direct apples-to-apples comparisons to be made between the nations' economic data. Here's the announcement of the program's elimination that appeared in the Federal Register on 25 June 2013:

The International Labor Comparisons (ILC) program adjusted foreign data to a common framework of concepts, definitions, and classifications to facilitate data comparisons between the United States and other countries. ILC data were used to assess United States economic performance relative to other countries, as well as to evaluate the competitive position of the United States in international markets.

On March 1, 2013, President Obama ordered into effect the across-the-board spending cuts (commonly referred to as sequestration) required by the Balanced Budget and Emergency Deficit Control Act, as amended. In order to achieve these budget cuts and protect core programs, The Bureau of Labor Statistics is eliminating the International Labor Comparisons program. Subject to BLS policies and procedures, the underlying data and the methodology used to produce the data will be available upon request.

Shutting down the ILC program had been one of the President's budget objectives for some time. The Washington Post described the ILC's operations and President Obama's desire to cut the program back on 3 March 2010:

President Obama's budget would eliminate the International Labor Comparisons office and transfer its 16 economists to expand the bureau's work tracking inflation and occupational trends. The White House says the cut, estimated to save $2 million, is one of many difficult decisions the president was forced to make to control spending.

On 27 June 2013, the non-profit Conference Board announced that it would take over reporting the international labor comparisons. (The Conference Board is the same outfit that conducts the Consumer Confidence Survey and that reports the Index of Leading Economic Indicators, both of which are frequently cited in the media.)

The Conference Board announced today that it will continue a statistical program on international labor statistics that is to be eliminated by the federal government due to across-the-board spending cuts. The Bureau of Labor Statistics, a unit of the United States Department of Labor, has announced that it will shut down the International Labor Comparison (ILC) program on July 1.

The program provides businesses, government agencies, academics, and the public with high-quality data on manufacturing productivity, unit labor costs, consumer price, wage rates, and employment and unemployment for up to 34 countries. It adjusts data to a common framework of concepts, definitions, and classifications to facilitate data comparisons across countries. ILC data are used to assess United States economic performance relative to other countries, as well as to evaluate the competitive position of the United States in international markets. The Conference Board will continue the program on its current basis and make the data available to the public at no cost. The Conference Board will implement the transition of the program over the summer.

"Every large company needs access to this data, and it can only be gathered effectively by leveraging non-commercial relationships between various government and statistical agencies around the world," said Jon Spector, President and CEO of The Conference Board. "If a government agency cannot continue to maintain this information, it requires an independent institution to take over the task."

Clearly, the Conference Board believes that there is value in sustaining the output of the International Labor Comparisons program. But the question we wanted to answer is "how many people will they seek to hire to do the work?"

Since the private sector Conference Board wasn't doing the work previously, to take on the new work, it would very likely have to both retask its current employees to add to their current job responsibilities while also creating new jobs specifically to do the additional work.

The number of dedicated new hires would be especially revealing because that would provide a direct indication of the relative productivity of people doing the exact same jobs in both the public and private sector. If the number of new hires in the private sector required to do the work turns out to be greater than the number of dedicated federal employees who were previously doing it, that would be a clear indication that the federal bureaucrats are more productive than their private sector peers, and thus are deserving of a higher level of compensation.

AHRQ.gov Bureaucrat Definition

As best as we can tell from its job postings since its announcement, the private sector Conference Board will hire at least two and possibly three people to do the work that would appear to have required 16 dedicated bureaucrats when the same work was done by the U.S. federal government. Here are the job descriptions for the positions that the Conference Board is seeking to fill related to this work:

The last Research Assistant position doesn't reference the International Labor Comparisons program, which means that it isn't the primary purpose of the position, but it's clear from the job description that the person hired to fill the opening could very well be tasked with work related to the ILC program. We should also recognize that it is possible that the job posting for the Research Analyst position that does specifically reference the ILC work may represent more than one opening with the same job description, but there is no indication that is the case in the description for the position, so we tend to think that is not the case.

Those things noted, these job postings suggest that the private sector Conference Board believes it will take the addition of no more than 3 people to do the same work that 16 bureaucrats were dedicated to doing as employees of the U.S. federal government. That would mean that the federal government employees who were previously doing the work would appear to be less than one-fifth as productive as their private sector peers in working to produce the same output.

We therefore find that the higher level of compensation for civilian federal government employees is not justifiable on the basis of their relative productivity with respect to similarly skilled and experienced workers in the private sector.

In fact, the lower apparent productivity of federal bureaucrats would also be a big reason why cuts to government spending reduces the nation's GDP by considerably less than the actual amount of the spending reduction.

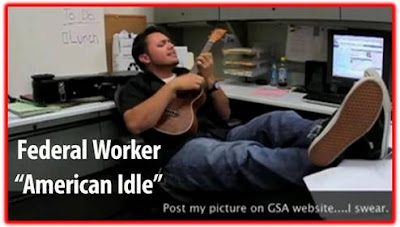
Federal Worker American Idle

Speaking of those 16 displaced federal government employees, since it appears that they have been reassigned to other areas within the Bureau of Labor Statistics, whose remaining workload is unchanged following the elimination of the International Labor Comparisons program, that means that the collective productivity of the federal government's employees at the BLS has decreased.

Of course, that is exactly what we should expect to happen when more people become involved in generating an unchanged level of output. But at least, in doing less work per person than before, but for the same pay, that means that their total compensation per person has become just ever so much greater than their private sector peers.

It's all just another perk of working for Uncle Sam!

References

Conference Board. The Conference Board Takes Over International Labor Statistics Program from the U.S. Government. [Online Article]. 27 June 2013.

Labor Statistics Bureau. International Labor Comparisons. [Online Article]. Federal Register. 25 June 2013.

MacGillis, Alec. Obama Administration Plans to Close International Labor Comparisons Office. [Online Article]. Washington Post. 3 March 2010.

Kamis, 15 Agustus 2013

The Twenty Percent President

According to the carefully crafted plan of the Obama administration, there would be one million electric cars cruising around America's streets and highways by 2015. According to the plan, almost half of those vehicles would be Chevrolet Volts.

So how well are President Obama's industrial policy plans working out in the real world?

The easiest way to find out is to count up the number of Chevrolet Volt sales over time. Electric vehicle industry observer InsideEVs provides a monthly scorecard of the number of sales recorded for each primarily electricity-powered automobile in the U.S., from which we extracted the data for GM's Chevrolet Volt and visualized in the following chart:

Chevrolet Volt Sales, December 2010 - July 2013

Through July 2013, we find that GM has sold a total of 43,111 Chevrolet Volts, which is about 161,889 vehicles short of the number that would need to be sold through this point of time to meet President Obama's planned sales total of 495,000 for these vehicles by 2015. That shortfall might help explain why GM has recently moved to mark down their recommended sale price for the Chevy Volt by $5,000.

Considering all of the primarily electricity-powered vehicles listed on InsideEVs monthly sales scorecard, through July 2013, some 117,788 electric vehicles have been sold in the United States. To reach President Obama's target of 1,000,000 electric automobiles sold by the end of 2015, some 882,212 more electric cars will have to be sold by December 2015.

That means that the number of sales of electric automobiles from August 2013 through December 2015 will have to average 30,421 per month between now and then. Through July 2013, the rolling twelve-month average for electric vehicle sales is 6,689 per month, a difference of 23,732 sales per month, which is about 78% below the average pace needed to hit President Obama's planned goal of having one million electric cars on the road by that time.

At present, the rolling twelve month average of Chevy Volt sales is nearly 80% below President Obama's planned average figure of 10,000 per month.

Put another way, there would appear to be an eighty percent difference between what President Obama promises and the reality of what he delivers.

And that would make Barack Obama the twenty percent President.

Update 16 August 2013: Writing at Innocent Bystanders, Geoff notes that we should have included one more graph in our analysis, which he has been kind enough to create: a comparison of President Obama's projected cumulative number of Chevy Volts that were supposed to be sold, and harsh reality:

Thanks Geoff!

References

U.S. Department of Energy. One Million Electric Vehicles by 2015, February 2011 Status Report. February 2011.

InsideEVs. Monthly Plug-In Sales Scorecard. Accessed 10 August 2013.

Previously on Political Calculations

  • Is the Government Subsidizing the Chevy Volt Enough? - we find that the $7,500 tax credit that the U.S. government was giving every buyer of GM's Chevrolet Volt was more than adequate to cover the relatively higher cost to the consumer for the Volt's electricity-driven engine.

  • Comparing MPGs for Alternative Fuel Vehicles - GM claimed the Chevy Volt will go 230 miles for every gallon of gasoline that it consumes. We built a tool to determine just what kind of mileage that consumers could really expect to get out of the electric car with the backup gasoline-powered engine.

  • Barack Obama: Crony Capitalist in Chief? Part 2 - after setting the stage in Part 1, we tell the sad story of a failing car company and how its electric car concept was used as the bait to commit a willing politician looking to grease the wheels of crony capitalism in America for political advantage into providing a massive taxpayer-funded bailout of the company.

  • Is GM Headed Back to Bankruptcy? - despite the President Obama's bailout of the company, we find that GM's financial situation is such that it is still in the danger zone for going through bankruptcy again.

Jumat, 28 Juni 2013

From Food Trucks to Mobile Factories

Thanks to the efforts of the Food Network, many Americans have become familiar with the gourmet food truck craze taking root in many cities across the United States.

What they might not know is that the economics of doing business is really behind the phenomenon. Compared to operating a restaurant at a fixed location, food trucks:

  • Can go to where people/customers are, creating more opportunities to generate revenue.

  • Tend to have lower ownership and overhead costs.

  • Maintain the same food preparation and cleanliness standards as fixed-base restaurants.

There are also a lot of challenges that can go along with owning and operating a food truck, which shouldn't be underestimated.

But all this just sets the stage for a new development that we want to consider: mobile factories.

It's natural to think of this possibility these days thanks to the advances of 3-D printing technology, but we're thinking more old school. What about putting a factory on wheels to support limited production runs for small producers, who haven't yet developed the revenue stream or the creditworthiness to invest in their own permanent production facilities to produce the kind of stuff for which 3-D printing just isn't cost competitive?

Perhaps something like a mobile cannery for local craft brewers?

Lindsey Herrema's Can Van

Image Source: SmartPlanet.

Gives a whole new meaning to the idea of what a beer truck can be now, doesn't it?

The mobile solution might be optimal for these kinds of producers because it's unlikely that the local canning and bottling operations for large-scale firm would contract with the small producers to can or bottle their product. Meanwhile, the cost of high volume bottling and canning equipment is such that it's unlikely that any contract canning or bottling firms are available nearby for handling small-scale runs.

But if you can put the equipment for bottling or canning beer on a truck, you can make it possible to grow a craft brewers' business - providing the small-scale service they need to be able to grow beyond the hand-bottling phase. They come to you, where you and your production equipment are, and make it possible for your facility to produce more than it could without a major capital investment.

That's something that wouldn't necessarily be limited to canning or bottling - we think that many packaging operations could be done this way, not to mention a wide variety of other manufacturing or production operations that can be done on a small scale (after all, the entire production facility would be based on a truck!) And really, the only small scale production or operation that couldn't be produced on mobile platforms are things that require high levels of precision, where it would be necessary to anchor equipment to a large vibration-isolated fixed mass to provide the necessary stability to support the production.

We think the economics of the mobile factory business would be very similar to that for food trucks - with many of the same advantages and disadvantages as their fixed, larger competition.

Some of those advantages would be more unique to different kinds of production. For example, if the only thing preventing a particular activity from taking place in a certain area is a local ordinance or regulation, and all it takes to make it economically feasible, not to mention perfectly legal, is to do it on the other side of a city, county or state line, a mobile factory might be a whole lot more cost effective than the cross-country transportation operation that might otherwise be required to reach a fixed-base facility where the job can be done.

On the other hand, suppose the operators of the mobile factories were more like pirates, who wheel in for a job that might not be permitted where its being done, who then drive off as quickly as its done?

When most people think of smugglers, we're pretty sure they think that they only smuggle goods, like cigarettes, or other illicit and highly regulated things. Who's to say that production can't someday be smuggled in just the same way? Or that it isn't already?

Jumat, 03 Mei 2013

The Future of Beer in Aluminum

CorruptedDevelopment - Blank Can Template We know it's hard to believe, but canned beer has an image problem. We thought we'd take this opportunity to shed some light on it.

Or perhaps not, because in reality, that's where the real problem begins.

You see, when beer is exposed to ultraviolet light, it will undergo a chemical reaction that produces the dreaded, skunky-flavored 3-methyl crotyl mercaptan molecule, which is all it takes to turn beer bad.

That's why good beer is typically not sold in clear-walled containers - brewers who care about their customer's beer consumption experience will do everything they can to keep their product from any exposure to sources of UV radiation, such as that produced by fluorescent lights or that is found in natural sunlight.

To get around that problem, brewers often use brown-colored glass for their bottled product, which blocks UV light from being able to penetrate to the beer inside. Other colors of glass bottles can work, but less well. Brewers who use these others types of colored glass bottles tend to do so for marketing or branding purposes - to visually distinguish their products on store shelves. But then their products' reputation tends to suffer (just ask any connoisseur of imported green-bottled Eurobeers. The same might be able to be said of the drinkers of Mexico's Corona lager, who have adapted by adding limes to their bottles to compensate for the unaltered taste!...)

Aluminum cans are excellent containers that also avoid this problem, but until very recently, they were only cost-effective to produce for the largest brewers. The brewers for whom mass-market sales represent the majority of their business, whose products are therefore broadly targeted.

And unfortunately as a consequence of targeting mass market appeal, whose products are therefore bland tasting.

That disconnect accounts for much of the image problem that canned beer has.

But now, things are changing because the economics of canning beer has changed. It has finally become much less expensive for smaller brewers to can their product, which is making it possible for more flavorful beers to be produced and brought to market using this technology.

And since craft brewers make their reputation, and their sales, by producing more flavorful beers, they're pushing canning technology as far as they can to make it better. The Core77 industrial design blog recently featured the following works in technological progress as examples of the innovations that might soon redefine the canned beer drinking experience. First up, what the brewers of Sam Adams are doing to amplify the flavor of beer that is consumed straight from the can:

Recently there's been word that a major brewer is introducing a yet another new can this summer. How much more design variance is possible in an aluminum beer can?

Samuel Adams' parent company, Boston Beer Co., hired IDEO to find out. The Sam Adams brand has famously eschewed cans for years; company founder Jim Koch, displaying a Steve-Jobs-like asceticism, felt that cans offered an inferior customer experience and refused to deal in them. But beer sold in cans is some 57% of the U.S. market, and are the only way beer can be served in certain places, like airplanes and stadiums. That translates to millions of dollars' worth. So two years ago, Koch decided he'd consider cans and contracted IDEO to design a better type.

What Sam Adams is looking to introduce this summer is a basic can that has been subtly redesigned to increase the amount of air flow over the beer inside to bring out more of its aroma while being consumed, which turns out to play a big role in how beer tastes. Here, the new can design features a wider top with a reshaped lip (shown on the right below, shown next to a standard can design on the left) - which is somewhat similar to the lip of the pint glass design that Sam Adams introduced several years ago.

Standard Aluminum Can Design (left) and IDEO Can Design Concept for Sam Adams (right)

Brewer Sly Fox has a similar idea - redesigning the pop-top of their can to expand over the entire top of the can:

Sly Fox 360 Can

Those are quite different from the kind of can innovations being developed by the mass-market brewers. The Belgian-Brazilian conglomerate that bought Anheuser-Busch is focusing on making a bow-tie shaped can to match the bow-tie shaped logo of their flagship product, which we suppose might also make it easier for their target demographic to hold:

New Budweiser Bowtie Can

Meanwhile, MillerCoors is focusing on making it easier for their consumers to consume their product faster:

MillerCoors Punch Top Can

We'll note that this design minimizes the amount of time that their consumers would have to deal with the aroma of the products they choose to package in these containers, which probably says quite a lot about the quality of those particular products.

There are some very different strategies at work here - it will be interesting to see if the intended consumer segments to whom these products will be targeted will respond the way the brewers hope.

Image Credits: Corrupted Development, Impulse Sports, and of course, Core77 (follow the various links in the post above!)

Elsewhere on the Web

Economist/brewer Phil Miller has a whole section of his blog dedicated to the intersection of beer and economics!

Rabu, 13 Maret 2013

In Which We Explain How Cuts in R&D Spending Can Affect GDP to President Obama

On Monday, 11 March 2013, President Obama[1] secretly asked us to explain the dynamics of how cuts in R&D spending might affect the nation's economic growth.

Here's the proof, as documented by StatCounter:

alt="StatCounter Detail 11 March 2013 - Executive Office of the President visit to Political Calculations' November 2009 post - The Link Between Intangible Investments and GDP" style="display: block; width: 600px; margin: 10px auto;" />

Here are the key points of what the President learned about how R&D cuts in the private sector can affect the economy, which we've tweaked from the material we originally presented for greater clarity:

In practice, when a company anticipates that it will not be able to afford its current level of new product development into the future, its management will begin a process of winnowing the list of research and development projects that it is willing to develop. That process occurs well in advance of the layoffs of the people who actually carry out the work involved with them.

Development projects are often reviewed and ranked according to their prospective return on investment (ROI) in that process. Here, projects that fail to meet a certain ROI threshold are discontinued, with the people engaged in those projects initially reallocated to other projects. In addition, the company's management may also kill a high ROI project, should they judge it to involve too much risk to continue developing in the fading economic climate it foresees.

Following this phase, the company's management evaluates its staffing needs to support the "winning" projects it will continue and this may lead to the resulting layoffs of its creative staff. Then the process repeats until whatever cost reduction target the company's leadership has set for its intangible investments has been met.

Before those layoffs occur however, it is the termination of the low ROI and high risk projects that may negatively impact GDP in the current timeframe, since the cancellation of the projects also terminates the relationships established between the company and its suppliers, vendors and customers to support them, to the extent that their businesses were relying upon the cancelled R&D projects for their revenue.

That change then ripples into the larger economy and also into the future, as the parties involved in these projects alter their own efforts to compensate for the loss. This contraction of economic activity then only subsides once sufficient new work makes it possible to reverse the process or when their costs have been brought in line to support their new level of revenue.

And from there, it's a question of whether those who might have been laid off have the skills needed for the new economy that forms. If there's a massive mismatch between the skills of the creative people who were let go and the opportunities available to them, the downturn for them can drag out for a very long time, especially for those employed in the industries that went from being the most high-flying to the most distressed.

Now, here is what the President has not yet learned, courtesy of MyGovCost, where the relative impact of government spending cuts and tax increases on the economy was recently discussed:

To understand why spending cuts like those of the sequester are considered to be so much less harmful to the economy than increasing taxes, let’s consider the real nature of government spending and taxes.

Here, when government raises taxes to support its discretionary spending, what it is doing is hurting a lot of people a little to benefit just a handful of politically-connected people, who just coincidentally happen to benefit a lot from government contracts (wink-wink). Because the harm is so widespread and the benefit limited to so few, the general economy suffers quite a bit as a result. Those effects are worse when the threat of additional tax increases remain after tax rate hikes are implemented.

But when a government cuts its spending, those dynamics work in reverse. Instead of lots of people being harmed a little, only a handful of people are. And since those people are significantly less likely to be engaged in sustainable economic activity in the first place, the economy at large is barely affected when their access to taxpayer money to fund their business income is reduced.

And that, in a nutshell, is why spending cuts are better for the economy than tax hikes for balancing a government’s budget.

The bottom line: Cuts in the U.S. government's R&D expenditures will have much less of an impact upon the U.S. economy than cuts in corporate R&D investments, thanks to the government's bizarre strategy of "investing" in wasteful, politically-driven, high-risk, low-return R&D efforts, such as those associated with "green" energy programs.

Notes

[1] Or more likely, one of the President's lowly minions trying to drum up arguments to oppose the spending cuts affecting government-funded R&D programs that are being negatively affected by the spending cuts mandated by President Obama's proposed budget sequester agreement from 2011.


Jumat, 22 Februari 2013

The Difference Between Being Pro-American and Anti-American at the U.S. Box Office

Movie Night - source: libraries.ne.govIt's not often that we can measure something like pro or anti-American political bias in American movies, but we can today because of a unique experiment conducted by Hollywood!

The reason why is because of the uneven level of quality of most movies, which can make it extremely difficult to make direct comparisons of a characteristic like political bias between them using the measure of how well they do at the box office. For example, one movie in a given genre might have good acting, but suffers from bad writing or poor direction. Another movie might have only okay acting and direction, but features really good writing.

That's often because different movies get made by different people, which introduces a lot of random elements into their production that can affect their quality, which in turn, affects their money-making potential. And then there's the matter of what audience the movie is aimed at - a movie targeted for teens will have a different box office performance than a movie targeted toward a older segment of the movie-going public.

But what happens when you put the same creative team to work behind movies that target the same basic audience demographic in the U.S., but are very different in their pro or anti-American political sentiment?

What happens is that you take out a lot of the randomness that might otherwise make a comparison between the movies produced by the same team invalid. You get a consistency of quality in all the other elements that can affect box office performance that makes it possible to measure just how much having a pro or anti-American political bias can have at the U.S. box office.

And that's exactly what we have today, thanks to the former Academy Award for Best-Picture winning The Hurt Locker and the current Academy Award Best-Picture nominee Zero Dark Thirty!

Both movies were made by same production team, including the director and screenwriter. Although they feature different actors, the overall quality of acting in The Hurt Locker and Zero Dark Thirty is also consistent, as measured by Academy Award nominations for the lead characters in each film.

Where they differ is in their political bias in how they present their stories, in which the post 9/11 U.S. war against terror is the backdrop. The Hurt Locker suggests that U.S. military servicemen conducting operations against terrorists are psychologically-impaired, irresponsible rogue elements who are dangers to themselves and others. Zero Dark Thirty portrays American spies and secret military operatives as devoted avengers of a horrific act of terror against the United States.

Same quality movie, made the most of the same people, different political bias. Our chart below shows the cumulative U.S. box office receipts as reported by Box Office Mojo for both The Hurt Locker and Zero Dark Thirty against the number of days since release in their original theater runs. We also show the inflation-adjusted box office for The Hurt Locker in terms of constant 2012 U.S. dollars:

The Difference Between Being Pro-American and Anti-American at the U.S. Box Office

Through their first 65 days of release, Zero Dark Thirty has made over seven times as much in U.S. box office receipts as did The Hurt Locker, with nearly $90 million in receipts just in the United States. That figure then represents the real difference between being pro and anti-American at the U.S. box office.

As for why Hollywood keeps making anti-American movies even though it would appear to cost them so much at the U.S. box office, well, when it comes to America, it seems they have other values....

Kamis, 22 November 2012

Busting Out of Black Friday

You know, it's bad enough that we see Christmas decorations start going up in some stores before the Fourth of July, but now, some big retailers just can't wait for dessert after Thanksgiving before trying to rack up more sales:

Retailers this year will open for Black Friday sales early enough to make shoppers choose between hot deals and hot apple pie after Thanksgiving dinner.

From Toys R Us to Target to Walmart, retailers are opening as early as 8 p.m. on Thanksgiving night.

Toys R Us announced Monday that its Black Friday will begin on Nov. 22 when doors open at 8 p.m, an hour earlier than last year.

To entice shoppers to line up even earlier, the toy retailer will give the first 200 customers at each location a free "Great Big Goody Bag" full of stocking-stuffers up to $30 in value.

"You can have your dinner, then come to our store. We all know that everybody gets burned out on turkey and football," says Troy Rice, chief of store operations, who expects stores to have lines from 500 to more than 1,000 people by the time doors open.

We think this is just a classic case of shifting consumer behavior, much like how sales tax holidays actually work. Here, instead of racking up more sales, as they might hope, U.S. retailers joining in this scheme are basically trading the timing of when their sales occur. It's not like consumers will have any more money to spend on an extra four hours of shopping....

Taking the Toys R Us promotion as an example, lining up to join in a bizarre shopping frenzy for $30 worth of "stocking-stuffers" (at Toys R Us' inflated "regular" prices - we suspect their actual cost for the items is around $10) some four hours earlier than retail tradition would dictate doesn't seem like that great a gain for the American consumer.

In the modern world, for those who just can't wait for the Black Friday shopping experience, there's no need to wait until 8:00 PM to get in on those Black Friday deals.... Or even to leave home....

The best part is that if enough consumers take advantage of the online alternatives, the other retailers looking to bust out of Black Friday will have to offer much, much better deals to consumers to try to draw them into their stores. And if doing that keeps their bottom line from going the way they might hope, they might be forced to stop the Black Friday bleedout because their sales don't justify the higher costs of having to be open longer.

And wouldn't that be a nice Thanksgiving treat!

Rabu, 21 November 2012

Who is "Big Turkey"?

Big Turkey is our cute name for the U.S.' largest turkey producers. Our chart below ranks who they are by the total live weight of turkeys they processed in 2011:

U.S. Turkey Producers Ranked by Live Weight Processed, 2011

The top three companies in our rankings, Butterball, Jennie-O Turkey Store and Cargill, account for over half of all turkeys processed in the United States.

As we noted yesterday, "Big Turkey" really isn't very profitable. With an average net profit margin of 2.9%, turkey producers, which would be grouped in the "Meat Products" sector of U.S. industries, would rank 171 out of some 215 industrial sectors.

But that's better than it appears - each of the publicly-traded companies that make up the list of companies in the Meat Products industry sector process more kinds of meat than just turkey, which do more to contribute to their profit margins. If not for the turkey segment of their businesses, the sector would have a higher net profit margin.

Selasa, 20 November 2012

The Illusion of Prosperity for U.S. Turkey Producers

It is very hard to make money in the turkey business.

In fact, low profit margins are the main reason that Smithfield Foods (NYSE: SFD) sold off its 49% stake in Butterball, the top producer of turkeys in the United States, for $175 million back in September 2010.

But U.S. turkey producers would appear have been on a tear since 2003, collecting more and more revenue in almost each year and now having more than doubled after having had mostly flat incomes in the 14 preceding years.

Annual Turkey Farm Income (All Producers), 1990-2011

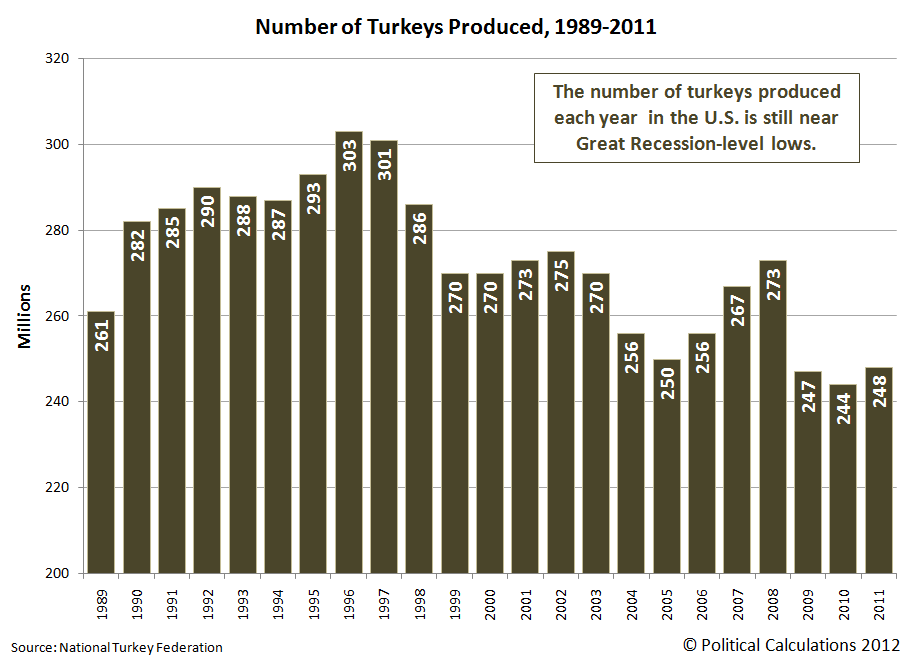
That increase in revenue becomes even more exaggerated when we consider the falling volume of turkeys produced over that time:

Number of Turkeys Produced, 1989-2011

Calculating the average income collected by turkey producers for each turkey they produce, we find that the average revenue collected per turkey has been rising at double-digit growth rates since 2003.

Average Farm Income per Turkey Produced, 1990-2011

And yet, "Big Turkey" is struggling to profit.

The only way this situation can exist is if the cost of producing turkeys in the United States to be rising at similar rates. Or more specifically, if U.S. turkey producers are directly passing on their higher costs of production to U.S. consumers on an almost dollar-for-dollar basis, which we can safely assume is the case given what we observe and the razor-thin profit margins for U.S. turkey producers.

So our question is what changed after 2003 that resulted in driving up the cost of producing turkeys in the United States in nearly every year since?

To find out, we began by looking at the main factors that can affect the cost of producing turkeys for market.

According to the University of Missouri's agriculture department, the cost of turkey feed can represent 70% of the cost of turkey production. With such a large share, we focused solely on this particular factor for our analysis.

Turkey feed typically consists of two main ingredients: soybeans and corn. Here, we observe that soybean prices suddenly spiked in 2003, then fell back to their pre-spike level in 2004 before beginning to increase in 2006. Meanwhile, the price of corn mostly held level until 2005, when it began to skyrocket in response to the U.S. federal government's increased ethanol fuel mandates - dipping only with the Great Recession in 2010.

The combination of the 2003 soybean price spike (which would be fed to turkeys in 2004) and the sharply increasing price of corn after 2005 would appear to account for nearly all of the increase in the cost of turkey production after 2003. Of the two, corn prices would appear to be the more significant driver, in that a larger and larger share of U.S. corn production has been required to be consumed to produce ethanol for use in motor vehicle fuel by the U.S. government over the years since 2005.

Percentage of U.S. Corn Crop Consumed by Ethanol Production and Corn Price per Bushel, 1980-2012

We should also note the role of the federal government's ethanol mandate in displacing other crop production, reducing supplies of those other crops while simultaneously increasing their costs at market.

And thus we discover the reality behind the illusion of prosperity for U.S. turkey producers. They've never generated more revenue, but they've never struggled so much to profit so little either.

That's the big reason why the industry isn't growing. The University of Missouri reflects on the role the industry's production cost increases have had on the state of the turkey business:

While such increases have boosted production costs of white meat and giblets, retail price pressure isn’t letting producers pass much to the consumer. Turkey eaters have reacted to price increases of almost eight percent over 2009 by eating more holiday ham and Thanksgiving pizza.

According to the US Department of Agriculture, turkey output dropped from 5,663 billion pounds in 2009 to 5,587 billion pounds last year, about a one percent reduction. Stocks of frozen whole birds also fell. Between September and October of last year, six percent fewer turkeys found themselves in freezers.

Grocers have tried to keep turkey prices low, even selling the birds below cost to attract holiday customers who load shopping cars with other goodies. With little opportunity to increase prices, producers have to eat higher costs to remain competitive.

In response, the turkey food industry now processes more meat into TV dinners, turkey ham and breasts, but this is only keeping pace with the decrease in holiday whole bird consumption. Annual consumption per capita has remained flat-lined for 30 years – about 16 pounds in some form, including Spam Turkey.

It is very hard to make money in the turkey business.

Kamis, 15 November 2012

Starbucks vs Starbucks

Will Starbucks (NYSE: SBUX) kill its own business with its Verismo single serving home brewer?

Think about it. Why would you go to Starbucks if you could get almost exactly the same product at home? Consider the following excerpt from the online Starbucks Store:

Your favorite Starbucks® beverages. All at home, all from one machine.

The machine that makes both espresso and brewed coffee. Now you can use the Starbucks recipes that we use in our coffeehouses to create the drinks you love - Caffè Latte, espresso, and a freshly brewed cup of Starbucks® coffee - at home. Our sweet creamy Caffè Latte, the original loved in our coffeehouses. Our caramelly rich true espresso, perfectly unchanged since our first handcrafted latte.

Let's say it is that good. Did Starbucks just slit its own throat?

To find out, we're going to compare the basic cost of brewing up one of Starbucks' Caffè Lattes at home compared to ordering one out while shopping, to see which makes more sense to the customer. Here are the costs we're considering:

By contrast, a Caffè Latte at our local Starbucks would cost us about $4.00.

So the question boils down to this: should we pay $199 to make our own Caffè Lattes at home for $1.62 each, or should we keep going to Starbucks to get them for $4.00 each?

To answer that question, we've adapted our Rent vs Buy tool to apply to this specific situation. Here, we've entered the costs we discussed above, and have also included other factors that might influence their value, such as the inflation rate for the Verismo pods or for Caffè Lattes purchased at your local Starbucks. We'll also consider the cost of money, which we're measuring as a typical interest rate that might apply for a low-rate credit card.


Caffè Latte Cost Data
Input Data Values
Cost to Make a Caffè Latte at Home
Cost to Buy a Caffè Latte at Starbucks
Number of Caffè Lattes per Year
Caffè Latte Cost Inflation Data
Rate of Inflation for Caffè Latte at Starbucks [%]
Rate of Inflation for Verismo Caffè Latte Pods [%]
Verismo Brewer Cost Data
Cost of a Starbucks Verismo Brewer
Cost of Money (Credit Card Interest Rate) [%]


Does It Make Sense to Buy a Verismo Brewer?
Calculated Results Values
Profitability [%]
The Bottom Line

In the tool above, we entered 260 for the number of your Caffè Lattes consumed per year, which works out to be about one per business day. We also set the inflation rate for the Verismo pods and cups at Starbucks to be the same, although it's likely that the inflation rate for one will be higher than that for the other.

Doing this math then, we find that it makes much more sense from a money standpoint to stop buying Caffè Lattes at our local Starbucks than it does to equip our home with a Verismo brewer, which would make it a desirable investment.

So to answer our original question, yes, the Verismo brewer has the capability of negatively impacting traffic at Starbucks store locations.

Keeping all the numbers the same except for the number of lattes consumed per year, we find that 10 Caffè Lattes per year would seem to be the division line between it making sense to buy a Verismo brewer versus buying your lattes at Starbucks. Assuming, of course, that the produced Caffè Latte you make at home is equivalent in quality to the store-purchased cup and that the brewers are available in the places where you want to consume your Caffè Lattes.

If not, that premium of $2.38 per latte is the extra price you'll pay for convenience.

In any case, our tool above will work for just about any of the single-server coffee brewers that have become popular in recent years - just plug in the numbers that apply for the situation you're considering, and we'll let you know if it ever comes close to making sense!

Having now run the numbers, we think that the introduction of the Verismo brewer is an interesting step for Starbucks, since it would clearly offer its strongest customers a more economically viable way of consuming Starbucks' products. All without the overhead of operating so many physical locations and the associated cost of maintaining staff at them and very likely generating a higher profit margin.

That would also free up a lot of prime commercial real estate if its customers reduce their store purchases, which we suspect might become an important source of revenue for the company as it adapts its business model.