Tampilkan postingan dengan label food. Tampilkan semua postingan

Jumat, 06 September 2013

The Past of Beer in Aluminum

We've previously explored the future of beer in aluminum, in which we considered how today's industrial designers are reshaping the aluminum beverage can to improve the beer drinking experience, but today, we're going to revisit the past to rediscover what the industrial designers of yore did to improve the beer drinking experience by bringing aluminum into the design of beverage cans in the first place!

Much like today's new college freshmen, who have no conception of a world without the Internet, entire generations of beer drinkers in America today have no conception of a time when beer couldn't be consumed from an aluminum can.

And yet, there was such a time. Before the early 1960s, most canned beer in the United States was contained within the same kind of tin-plated steel can that today is more familiarly found in the canned vegetable aisle at the grocery store.

And that was a problem for many beer drinkers, who had to rely upon using church key can openers to punch holes into the flat tops of their steel beer cans so they could consume the contents, because it required some physical strength to break through.

So yesterday's industrial designers went to work to improve the beer drinking experience of these consumers by replacing the old steel lid on top of the old-fashioned beer can with a new and improved aluminum lid design that was a lot easier to punch through with a church key opener. Here's an old Schlitz beer ad from the early 1960s trumpeting the new innovation (HT: Freakonomics):

Schlitz softop beer ad, early 1960s - Source: Freakonomics

RustyCans describes the history of the introduction of aluminum into the design of beer cans:

In 1960 Cincinnati's Burger Brewing Company tried an experiment to alleviate the complaints of people who found it difficult to punch a hole in the lid of the flat top cans with a churchkey. Flat tops cans had been the first beer cans used, starting in 1935, and you used a churchkey to open a triangular shaped hole in the steel/tin lid to pour out the beer.

As time went on cans had begun using thinner metal, including on the lids, but it still took a little bit of strength to use a churchkey. Cone top cans, which had a crown on the top like a bottle, had also come into use in 1935, but by 1960 only one or two brewers were still using them. Burger Beer, along with Cincinnati’s Heekin Can Company and Kaiser Aluminum decided to make the flat top can a bit more user friendly. Burger began using a aluminum lid which was much easier to punch into with a churchkey than the normal lids.

The idea was not new to Burger. European breweries had been using aluminum cans for several years and both Primo and Coors breweries had been using (with mixed success) all aluminum cans. Other breweries would soon follow. Burger, however, was the first US brewer (and maybe the first anywhere) to use the aluminum lid along with a normal "tin" can.

The new lid, named the "E-Z Open," was introduced in the Summer of 1960. (see August 2008 COM for details). The lids did prove popular. Many other breweries used them. Lone Star in Texas adopted them early. Schlitz Brewing was the first national brewery to adopt the new lids. They used other names besides “E-Z Open” including “Softop.” The lids also provided a space to include brewery logos, brand names, tax stamps, etc.

While the new lids were a success, they were short-lived. In 1962 Iron City began testing a pull top can that didn’t need a church key to open at all, the zip top (or pull tab). Schlitz adopted the pull tab in 1963 and by 1965 over three-quarters of all breweries were using them, including Burger. However, for a short time the E-Z Open lid was a popular feature on many cans as brewers fought for some sort of marketing advantage.

And thus, the modern age of beer drinking in America came to be!

Jumat, 03 Mei 2013

The Future of Beer in Aluminum

CorruptedDevelopment - Blank Can Template We know it's hard to believe, but canned beer has an image problem. We thought we'd take this opportunity to shed some light on it.

Or perhaps not, because in reality, that's where the real problem begins.

You see, when beer is exposed to ultraviolet light, it will undergo a chemical reaction that produces the dreaded, skunky-flavored 3-methyl crotyl mercaptan molecule, which is all it takes to turn beer bad.

That's why good beer is typically not sold in clear-walled containers - brewers who care about their customer's beer consumption experience will do everything they can to keep their product from any exposure to sources of UV radiation, such as that produced by fluorescent lights or that is found in natural sunlight.

To get around that problem, brewers often use brown-colored glass for their bottled product, which blocks UV light from being able to penetrate to the beer inside. Other colors of glass bottles can work, but less well. Brewers who use these others types of colored glass bottles tend to do so for marketing or branding purposes - to visually distinguish their products on store shelves. But then their products' reputation tends to suffer (just ask any connoisseur of imported green-bottled Eurobeers. The same might be able to be said of the drinkers of Mexico's Corona lager, who have adapted by adding limes to their bottles to compensate for the unaltered taste!...)

Aluminum cans are excellent containers that also avoid this problem, but until very recently, they were only cost-effective to produce for the largest brewers. The brewers for whom mass-market sales represent the majority of their business, whose products are therefore broadly targeted.

And unfortunately as a consequence of targeting mass market appeal, whose products are therefore bland tasting.

That disconnect accounts for much of the image problem that canned beer has.

But now, things are changing because the economics of canning beer has changed. It has finally become much less expensive for smaller brewers to can their product, which is making it possible for more flavorful beers to be produced and brought to market using this technology.

And since craft brewers make their reputation, and their sales, by producing more flavorful beers, they're pushing canning technology as far as they can to make it better. The Core77 industrial design blog recently featured the following works in technological progress as examples of the innovations that might soon redefine the canned beer drinking experience. First up, what the brewers of Sam Adams are doing to amplify the flavor of beer that is consumed straight from the can:

Recently there's been word that a major brewer is introducing a yet another new can this summer. How much more design variance is possible in an aluminum beer can?

Samuel Adams' parent company, Boston Beer Co., hired IDEO to find out. The Sam Adams brand has famously eschewed cans for years; company founder Jim Koch, displaying a Steve-Jobs-like asceticism, felt that cans offered an inferior customer experience and refused to deal in them. But beer sold in cans is some 57% of the U.S. market, and are the only way beer can be served in certain places, like airplanes and stadiums. That translates to millions of dollars' worth. So two years ago, Koch decided he'd consider cans and contracted IDEO to design a better type.

What Sam Adams is looking to introduce this summer is a basic can that has been subtly redesigned to increase the amount of air flow over the beer inside to bring out more of its aroma while being consumed, which turns out to play a big role in how beer tastes. Here, the new can design features a wider top with a reshaped lip (shown on the right below, shown next to a standard can design on the left) - which is somewhat similar to the lip of the pint glass design that Sam Adams introduced several years ago.

Standard Aluminum Can Design (left) and IDEO Can Design Concept for Sam Adams (right)

Brewer Sly Fox has a similar idea - redesigning the pop-top of their can to expand over the entire top of the can:

Sly Fox 360 Can

Those are quite different from the kind of can innovations being developed by the mass-market brewers. The Belgian-Brazilian conglomerate that bought Anheuser-Busch is focusing on making a bow-tie shaped can to match the bow-tie shaped logo of their flagship product, which we suppose might also make it easier for their target demographic to hold:

New Budweiser Bowtie Can

Meanwhile, MillerCoors is focusing on making it easier for their consumers to consume their product faster:

MillerCoors Punch Top Can

We'll note that this design minimizes the amount of time that their consumers would have to deal with the aroma of the products they choose to package in these containers, which probably says quite a lot about the quality of those particular products.

There are some very different strategies at work here - it will be interesting to see if the intended consumer segments to whom these products will be targeted will respond the way the brewers hope.

Image Credits: Corrupted Development, Impulse Sports, and of course, Core77 (follow the various links in the post above!)

Elsewhere on the Web

Economist/brewer Phil Miller has a whole section of his blog dedicated to the intersection of beer and economics!

Jumat, 26 April 2013

Stranded in the Food Desert

Science is a wonderful tool for understanding how our world really works. But if the science supporting a given understanding is flawed, or worse, if it is slanted in favor of a politically-favored outcome, it can become the justification for excessively wasteful activities. When science crosses that line, it is transformed from something that is worthy of respect into junk science.

This is the story of Michelle Obama and her fight against the food deserts of America. The story begins on 24 February 2010, when the First Lady of the United States of America used her White House platform to introduce the little-understood concept of the newly-discovered "food deserts" of America to Americans as part of a media blitz:

As part of Lets Move!, the campaign to end childhood obesity, First Lady Michelle Obama is taking on food deserts. These are nutritional wastelands that exist across America in both urban and rural communities where parents and children simply do not have access to a supermarket. Some 23.5 million Americans – including 6.5 million children – currently live in food deserts. Watch the video below and learn what the First Lady is doing to help families in these areas across the country.

Food deserts sound horrible. Isn't it good that the First Lady is doing something about this awful problem that would appear to be plaguing America's most poor, yet obese citizens, who suffer because they are deprived from having large supermarkets stocked with nutritious foods within walking distance of where they live?

Big Pine Canyon, Big Bend National Park - Source: National Park Service

Or is the First Lady relying upon junk science to justify the wasteful expenditure of taxpayer money to benefit her and the President's political cronies? After all, there was already plenty of evidence back in 2010 that indicated that food deserts were more a junk science-fueled political talking point than a real factor that significantly contributed to making poor Americans obese, as the original 2006 study proclaiming the crisis in President Obama's home base of Chicago was funded by LaSalle Bank of Chicago, then the largest business lender in the city, who would directly profit from investments to "remedy" the situation.

Fortunately, respectable science can help provide the answers to these questions. The U.S. Centers for Disease Control very recently published a peer-reviewed scientific study of the impact that a lack of nearby access to nutritious foods, such as might be found in one of the First Lady's food deserts, actually has upon the Body Mass Index (BMI) of the Americans who live within such regions. Here are the results and conclusion for their study of 97,678 adults in the state of California (home to 1 out of every 8 Americans):

Results

Food outlets within walking distance (≤1.0 mile) were not strongly associated with dietary intake, BMI, or probabilities of a BMI of 25.0 or more or a BMI of 30.0 or more. We found significant associations between fast-food outlets and dietary intake and between supermarkets and BMI and probabilities of a BMI of 25.0 or more and a BMI of 30.0 or more for food environments beyond walking distance (>1.0 mile).

Conclusion

We found no strong evidence that food outlets near homes are associated with dietary intake or BMI. We replicated some associations reported previously but only for areas that are larger than what typically is considered a neighborhood. A likely reason for the null finding is that shopping patterns are weakly related, if at all, to neighborhoods in the United States because of access to motorized transportation.

Economist Jacob Geller reviewed the study's statistical results:

If you look at the statistical tables, they’re pretty striking. Even where there is statistical significance — which is the exception to the rule — the size of the effect is so tiny, it’s like practically nothing. For example, on the margin, adding one full-service supermarket within a one-mile radius of your house is associated with an average BMI decrease in your neighborhood of .115. That is a difference of just one pound. (see back-of-the-envelope calculations here)

So there is really no relationship, according to this one recent study of nearly 100,000 Californians, between the distance between your body and a full-service supermarket (or any other kind of food store), and whether or not you are obese. Distance, which is a proxy for access (the idea of a food desert is that the nearest supermarket, which has fresh produce, is distant), is for all practical purposes a non-factor.

We created the following tool so you can see what Michelle Obama's publicity campaign to direct large and/or politically well-connected retailers to spend millions of dollars to open or expand stores in the "disadvantaged" regions identified by the U.S. government as supposed food deserts would have in terms of your own weight. And the cool part is that the math is such that we can figure out just how much that would be for you from just your height!


Your Height
Input Data Values
Your Height [inches]


Your "Food Desert" Weight
Calculated Results Values
Amount in Weight [pounds]

If you're accessing this tool on a site that republishes our RSS news feed, please click here to access the original, functioning version of this tool!

Our tool indicates how much of your weight would be affected by whether you lived within a food desert. If you live in an area identified by the U.S. government as a food desert, it indicates how much more you would weigh, and if you were to move out of that area, it is how much you would lose. To put your result into proper context, the weight of an adult American normally fluctuates by up to 5 pounds during the course of a single day.

Did we mention large and/or politically well-connected retailers are involved? That's actually how we know that the whole food desert publicity campaign is really about crony capitalism more than it is about dealing with the health problems of obesity. Because in truth, if it were a real problem that could be fixed by opening new store locations, it would be a lot easier, cheaper and faster for small "Mom and Pop"-style grocery businesses to fit themselves into the already existing and available retail spaces within such deprived communities as the supposed food deserts of America.

But since the whole food desert concept would seem to be based on junk science rather than the more respectable kind, it is perhaps too much to ask for the solutions advanced by the politicians taking charge of the crisis to solve a legitimate problem.

References

Carras, Michelle Colder. Normal Body Weight Fluctuation. LiveStrong.com. http://www.livestrong.com/article/29567-normal-body-weight-fluctuation/. 7 May 2011.

Croft, Cammie. Food desert? What’s a food desert? White House Blog. http://www.whitehouse.gov/blog/2010/02/24/taking-food-deserts. 24 February 2010.

Gallagher, Mari. Examining the Impact of Food Deserts on Public Health in Chicago. http://www.marigallagher.com/site_media/dynamic/project_files/Chicago_Food_Desert_Report.pdf. Mari Gallagher Research & Consulting Group, sponsored by LaSalle Bank. 2006.

Geller, Jacob A. The Problem of "Food Deserts" Is Not All About Access. http://jacobageller.com/2013/04/the-problem-of-food-deserts-is-not-all-about-access/. 3 April 2013.

Hattori A, An R, Sturm R. Neighborhood Food Outlets, Diet, and Obesity Among California Adults, 2007 and 2009. Prev Chronic Dis 2013;10:120123. DOI: http://dx.doi.org/10.5888/pcd10.120123. 14 March 2013.

McWhorter, John. The Root: The Myth of the Food Desert. National Public Radio. http://www.npr.org/2010/12/15/132076786/the-root-the-myth-of-the-food-desert. 15 December 2010.

Mooney, Alexander. First Lady Takes on 'Food Deserts'. CNN: The 1600 Report. http://whitehouse.blogs.cnn.com/2011/07/20/first-lady-takes-on-%E2%80%98food-deserts%E2%80%99/. 20 July 2011.

Political Calculations. How To Detect Junk Science. http://politicalcalculations.blogspot.com/2009/08/how-to-detect-junk-science.html. 19 August 2009.

White House. Transcript of President Obama's Remarks at 2013 White House Science Fair. White House Photos and Video. http://www.whitehouse.gov/photos-and-video/video/2013/04/22/president-obama-tours-2013-white-house-science-fair#transcript. 22 April 2013.

Wright, Ann. Interactive Web Tool Maps Food Deserts, Provides Key Data. http://www.letsmove.gov/blog/2011/05/03/interactive-web-tool-maps-food-deserts-provides-key-data. LetsMove.gov. 3 May 2011.


Jumat, 15 Maret 2013

Inventions in Everything: The Oreo Separator Machine

How much does a guy have to dislike the creme filling in delicious Oreo cookies that he is inspired to devise an invention as intricate as what you're about to see just to accomplish the desired task of removing the creme without coming into direct contact with any of it?

Now that's genius! (HT: Core77)

Selasa, 20 November 2012

The Illusion of Prosperity for U.S. Turkey Producers

It is very hard to make money in the turkey business.

In fact, low profit margins are the main reason that Smithfield Foods (NYSE: SFD) sold off its 49% stake in Butterball, the top producer of turkeys in the United States, for $175 million back in September 2010.

But U.S. turkey producers would appear have been on a tear since 2003, collecting more and more revenue in almost each year and now having more than doubled after having had mostly flat incomes in the 14 preceding years.

Annual Turkey Farm Income (All Producers), 1990-2011

That increase in revenue becomes even more exaggerated when we consider the falling volume of turkeys produced over that time:

Number of Turkeys Produced, 1989-2011

Calculating the average income collected by turkey producers for each turkey they produce, we find that the average revenue collected per turkey has been rising at double-digit growth rates since 2003.

Average Farm Income per Turkey Produced, 1990-2011

And yet, "Big Turkey" is struggling to profit.

The only way this situation can exist is if the cost of producing turkeys in the United States to be rising at similar rates. Or more specifically, if U.S. turkey producers are directly passing on their higher costs of production to U.S. consumers on an almost dollar-for-dollar basis, which we can safely assume is the case given what we observe and the razor-thin profit margins for U.S. turkey producers.

So our question is what changed after 2003 that resulted in driving up the cost of producing turkeys in the United States in nearly every year since?

To find out, we began by looking at the main factors that can affect the cost of producing turkeys for market.

According to the University of Missouri's agriculture department, the cost of turkey feed can represent 70% of the cost of turkey production. With such a large share, we focused solely on this particular factor for our analysis.

Turkey feed typically consists of two main ingredients: soybeans and corn. Here, we observe that soybean prices suddenly spiked in 2003, then fell back to their pre-spike level in 2004 before beginning to increase in 2006. Meanwhile, the price of corn mostly held level until 2005, when it began to skyrocket in response to the U.S. federal government's increased ethanol fuel mandates - dipping only with the Great Recession in 2010.

The combination of the 2003 soybean price spike (which would be fed to turkeys in 2004) and the sharply increasing price of corn after 2005 would appear to account for nearly all of the increase in the cost of turkey production after 2003. Of the two, corn prices would appear to be the more significant driver, in that a larger and larger share of U.S. corn production has been required to be consumed to produce ethanol for use in motor vehicle fuel by the U.S. government over the years since 2005.

Percentage of U.S. Corn Crop Consumed by Ethanol Production and Corn Price per Bushel, 1980-2012

We should also note the role of the federal government's ethanol mandate in displacing other crop production, reducing supplies of those other crops while simultaneously increasing their costs at market.

And thus we discover the reality behind the illusion of prosperity for U.S. turkey producers. They've never generated more revenue, but they've never struggled so much to profit so little either.

That's the big reason why the industry isn't growing. The University of Missouri reflects on the role the industry's production cost increases have had on the state of the turkey business:

While such increases have boosted production costs of white meat and giblets, retail price pressure isn’t letting producers pass much to the consumer. Turkey eaters have reacted to price increases of almost eight percent over 2009 by eating more holiday ham and Thanksgiving pizza.

According to the US Department of Agriculture, turkey output dropped from 5,663 billion pounds in 2009 to 5,587 billion pounds last year, about a one percent reduction. Stocks of frozen whole birds also fell. Between September and October of last year, six percent fewer turkeys found themselves in freezers.

Grocers have tried to keep turkey prices low, even selling the birds below cost to attract holiday customers who load shopping cars with other goodies. With little opportunity to increase prices, producers have to eat higher costs to remain competitive.

In response, the turkey food industry now processes more meat into TV dinners, turkey ham and breasts, but this is only keeping pace with the decrease in holiday whole bird consumption. Annual consumption per capita has remained flat-lined for 30 years – about 16 pounds in some form, including Spam Turkey.

It is very hard to make money in the turkey business.

Senin, 19 November 2012

U.S. Turkeys: Bigger than Ever!

It's Thanksgiving week once again here at Political Calculations, where our tradition calls for us to put aside everything else we're working on and celebrate the most American of all national holidays for an entire week.

We're kicking off this week's holiday festivities by considering just what "Big Turkey", the conglomeration of the biggest turkey producers in the U.S., are seeking to put in the center of every American dining table on this holiday: a big turkey!

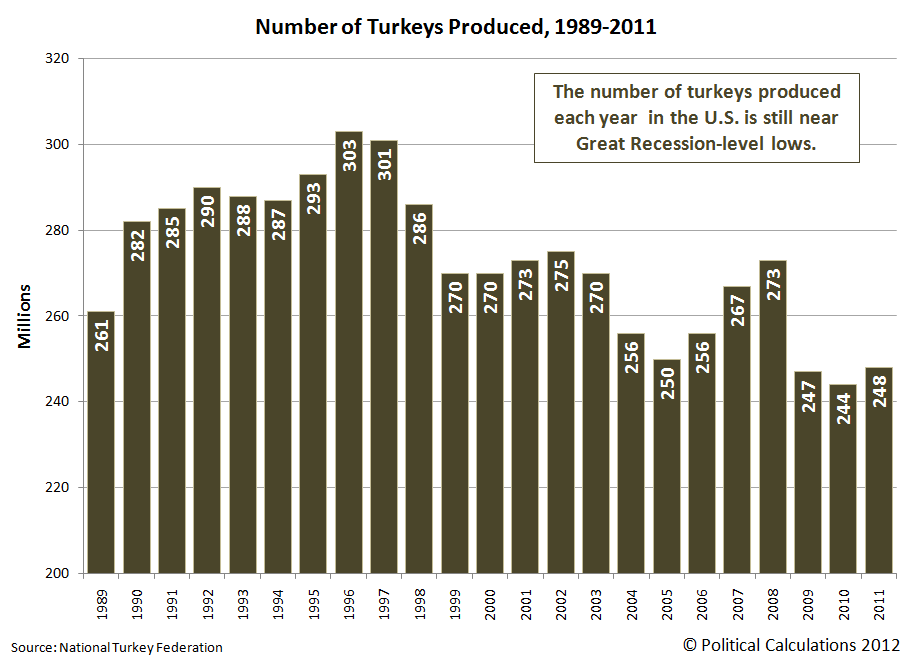
But first, let's see just how many turkeys we're talking about. Drawing upon statistics collected and published by the National Turkey Federation, we put together the following chart showing how many turkeys made it from farm to table in each year from 1989 through 2011:

Number of Turkeys Produced, 1989-2011

Here, we see after peaking at 303 million birds in 1996, which coincided with the height of the low-fat diet craze, the number of turkeys produced each year fell off to range between 250 million and 275 million through 2008.

However, the aftermath of the Great Recession took a big bite out of U.S. turkey production beginning in 2009, sending annual turkey production below the 250 million mark.

You would think then that America's turkey farmers are producing less turkey today than at any time since 1989, the first year for which we have annual turkey production figures.

You would, of course, be wrong. In reality, 2011 marked the fourth-highest year on record for total amount of turkeys to go to the market, as measured by their live weight:

Total Live Weight of Turkeys Produced, 1989-2011

The only way that mathematically works is for the size of turkeys produced in the U.S. to increase pretty dramatically. Doing the math, we find that's exactly what has happened!

Average Live Weight of Each Turkey Produced, 1989-2011

On average, we find that the average live weight of a turkey produced in the United States has risen from 21 pounds per bird in 1989 to reach 29.5 pounds today.

That's a 41% increase in the weight of a live turkey produced for market in the U.S. in the last twenty-three years. To help put that increase in perspective, the largest "heritage" or wild turkeys will weigh in at just 16 pounds per bird.

So that's what "Big Turkey" has been up to over much of the last twenty three years (and longer!) In our next installment, we'll see just how much money "Big Turkey" makes on each one of those birds!

References

National Turkey Federation. Turkey Statistics. Accessed 12 November 2012.

Kamis, 15 November 2012

Starbucks vs Starbucks

Will Starbucks (NYSE: SBUX) kill its own business with its Verismo single serving home brewer?

Think about it. Why would you go to Starbucks if you could get almost exactly the same product at home? Consider the following excerpt from the online Starbucks Store:

Your favorite Starbucks® beverages. All at home, all from one machine.

The machine that makes both espresso and brewed coffee. Now you can use the Starbucks recipes that we use in our coffeehouses to create the drinks you love - Caffè Latte, espresso, and a freshly brewed cup of Starbucks® coffee - at home. Our sweet creamy Caffè Latte, the original loved in our coffeehouses. Our caramelly rich true espresso, perfectly unchanged since our first handcrafted latte.

Let's say it is that good. Did Starbucks just slit its own throat?

To find out, we're going to compare the basic cost of brewing up one of Starbucks' Caffè Lattes at home compared to ordering one out while shopping, to see which makes more sense to the customer. Here are the costs we're considering:

By contrast, a Caffè Latte at our local Starbucks would cost us about $4.00.

So the question boils down to this: should we pay $199 to make our own Caffè Lattes at home for $1.62 each, or should we keep going to Starbucks to get them for $4.00 each?

To answer that question, we've adapted our Rent vs Buy tool to apply to this specific situation. Here, we've entered the costs we discussed above, and have also included other factors that might influence their value, such as the inflation rate for the Verismo pods or for Caffè Lattes purchased at your local Starbucks. We'll also consider the cost of money, which we're measuring as a typical interest rate that might apply for a low-rate credit card.


Caffè Latte Cost Data
Input Data Values
Cost to Make a Caffè Latte at Home
Cost to Buy a Caffè Latte at Starbucks
Number of Caffè Lattes per Year
Caffè Latte Cost Inflation Data
Rate of Inflation for Caffè Latte at Starbucks [%]
Rate of Inflation for Verismo Caffè Latte Pods [%]
Verismo Brewer Cost Data
Cost of a Starbucks Verismo Brewer
Cost of Money (Credit Card Interest Rate) [%]


Does It Make Sense to Buy a Verismo Brewer?
Calculated Results Values
Profitability [%]
The Bottom Line

In the tool above, we entered 260 for the number of your Caffè Lattes consumed per year, which works out to be about one per business day. We also set the inflation rate for the Verismo pods and cups at Starbucks to be the same, although it's likely that the inflation rate for one will be higher than that for the other.

Doing this math then, we find that it makes much more sense from a money standpoint to stop buying Caffè Lattes at our local Starbucks than it does to equip our home with a Verismo brewer, which would make it a desirable investment.

So to answer our original question, yes, the Verismo brewer has the capability of negatively impacting traffic at Starbucks store locations.

Keeping all the numbers the same except for the number of lattes consumed per year, we find that 10 Caffè Lattes per year would seem to be the division line between it making sense to buy a Verismo brewer versus buying your lattes at Starbucks. Assuming, of course, that the produced Caffè Latte you make at home is equivalent in quality to the store-purchased cup and that the brewers are available in the places where you want to consume your Caffè Lattes.

If not, that premium of $2.38 per latte is the extra price you'll pay for convenience.

In any case, our tool above will work for just about any of the single-server coffee brewers that have become popular in recent years - just plug in the numbers that apply for the situation you're considering, and we'll let you know if it ever comes close to making sense!

Having now run the numbers, we think that the introduction of the Verismo brewer is an interesting step for Starbucks, since it would clearly offer its strongest customers a more economically viable way of consuming Starbucks' products. All without the overhead of operating so many physical locations and the associated cost of maintaining staff at them and very likely generating a higher profit margin.

That would also free up a lot of prime commercial real estate if its customers reduce their store purchases, which we suspect might become an important source of revenue for the company as it adapts its business model.

Jumat, 31 Agustus 2012

Beer as an Economic Indicator

We wish we had thought of this, but credit belongs to Business Insider's Joe Weisenthal (HT: Lorenzo), who has worked out how the price of beer correlates with the economic health of various European nations:

Critical to understanding the European crisis is understanding the divergent price levels in the varying countries.

What basically happened over the past several years is: Prices of everything surged in the periphery of Europe, while staying incredibly stable in Germany. This has been a boon to Corporate Deutschland, as it is far more competitive—on a price basis—than all of its peers.

Now the peripheral countries are being asked to devalue and regain competitiveness, but it is a difficult if not impossible task. The problem is that when devaluing an economy the legacy debts remain, and so the sovereign debt of the country stays there, while all of the internal income goes down. And you get a crisis.

So naturally the first thing we did when checking out the new European pricing data is check out the price of beer.

And the chart is a doozy.

What we've done here is charted the price of beer in Greece (blue), Italy (orange), Spain (red), Ireland (green), and Germany (black). Now this is an index chart; essentially the beer component of the CPI. We've set the index to start at 100 in 1996.

The first thing you see is that Greek inflation is WAY above everyone else.

The next thing you see is that Germany has had very little beer inflation since 1996.

Spain and Italy have seen surging prices.

And Ireland (in Green) did once have a huge price bubble, but has now seen significant beer deflation. And not surprisingly, Ireland is seen as having made far and away more progress in its efforts at regaining health.

So really the beer chart says it all: Greece: a wreck. Germany: calm. Spain and Italy: in trouble, and Ireland making a comeback.

The entire European crisis explained by the price of beer.

Genius!


Jumat, 06 April 2012

What's for Dinner? What?!

You probably won't be surprised by this, but a number of enterprising visionaries, and even some European governments, are working to solve the world's potential food supply problems of the year 2050.

What will surprise you is what they think will be for dinner: insects. Via Core77, they explain why:

Why eat insects?

As postgraduate design students, our team wanted to tackle the issue of sustainability with an innovative design-driven approach. We first came across the idea of eating insects when researching solutions to global food security. Food demand is accelerating, and agricultural productivity cannot keep up. By 2050 global demand is set to double to 40 giga-calories per day, and much of this increase will be due to demand for meat.

The livestock industry is notoriously resource-hungry, consuming a third of all crops and requiring 70% of agricultural land. It also accounts for 20% of greenhouse gas emissions, through production, transport and animal digestive gas.

It is against this backdrop that edible insects offer an exciting alternative. They are extremely efficient at turning feed into meat and can be farmed at a very high density. This means that their embodied energy is low—a tenth of that of beef cattle—and that at high volumes they are very cost efficient. Taking their nutritional benefits into consideration as well, it is easy to understand why the UN, the EU, and the Dutch government are some of the major players investigating the potential of edible insects.

But despite the fact that a lot of people taking this idea very seriously, most of the research to date has focused on the supply side. We realized that there was an opportunity to address one of biggest obstacles on the demand side: acceptance.

Currently there is a major cultural taboo against eating insects. The idea of eating insects is generally imagined to be dirty, gooey and unsafe. None of these preconceptions are true, but it doesn't change the fact that edible insects are certainly not seen as an exciting future food! We realized that changing these beliefs would be a major challenge.

But that's not the only challenge! Aside from the aesthetic, cultural and culinary aspects, there are also technical and business problems that must be tackled today to bring the food of the future to the market in the future:

Meeting demand

We weren't content to propose introducing our new foods without doing some calculations on the how we might supply them. When we did the math for the farming that would support the enterprise, some rather large numbers confronted us: a single restaurant would require a supply of one million insects per month (300kg)! And this number would grow quickly as our enterprise scaled up.

In order to ground the rest of our work in reality, we needed to make sure we would be able to design the farms capable of doing this.

Our solution is a flexible network of urban farms, which reduce the food miles of our food and activate unused urban land. The proposed farming system is extremely scalable, in order to cope with the varying levels of demand in our roadmap.

Inside these farms, we designed a series of modular cabinets. Each cabinet supports 32,000 insects: the top drawer houses the parents, the offspring of which populate and refresh the lower drawers. The insects instinctively perch on several vertical racks, which can be pulled out after 6 weeks of maturing. An integrated bag is then pulled down over this rack and the insects inside are now ready to be frozen and transferred straight to the kitchen.

With Ento we have taken into account economic, engineering and design considerations. This is a new way of addressing the very serious issues of food security and protein sustainability. Edible insects offer a tasty and healthy addition to people's diets that benefits the planet by dramatically reducing embodied energy and water use. We hope to take this project forward and make insects a regular sight in your local supermarket.

So.... Who's up for grasshopper sushi?

Jumat, 16 Maret 2012

Three of Ten Things You Don't Need on St. Patrick's Day

It's a little known fact that in addition to being the patron saint of Ireland, Nigeria and the excluded, St. Patrick is also the patron saint of engineers.


Because of that, celebrating St. Patrick's Day is about more than wearing green and drinking beer. It's also about drinking away the sorrows and memories that go with really bad engineering.


To that end, we're going to highlight three beer-drinking related inventions that really deserve to be forgotten on this St. Patrick's day. In fact, they appeared among InventorSpot's Luke McKinney's list of Ten Things You Don't Need on St. Patrick's Day, a list of things that might have seemed like they would be good inventions when their respective inventors were drinking, some heavily, but weren't for the reasons Luke identifies....


First up, the engineering disaster that is... "beer shorts":


Beer Shorts Straight from a college movie, a sneaky way to smuggle beer into guarded or expensive areas. The reason it works in movies is because you don't see the awkwardness of wearing them, or feel the terrible sensations of walking with loose sacks of liquid strapped to your nether regions. To say nothing of the shame of being caught in what look like floppy cyber-diapers . And if you can't see the problem in wearing large sacks of booze around your crotch in public, then you're likely too drunk to even read this right now.


We know what you're thinking: "What about the ladies? Surely there must be some other invention that required some really bad engineering to put together so women can also have an invention for secretly transporting beer on their persons! One that wouldn't make their hips look bigger, because apparently, that's not necessarily a good thing."


And you would would be right. Let's call that badly engineered invention: "The Beer Rack":


Beer Rack Hey there lady, do you wish you could simultaneously carry free beer and have bigger breasts? Then congratulations, you don't need to buy anything because you're a figment of a teenage boys imagination! Thrillist, however, are ready should you ever exist with the Winerack. They point out how smuggling bladders of booze on your chest makes your breasts look bigger. They don't say anything about dealing with mammaries that deflate and turn wrinkly over the course of the night - though you could view it as training for life.


Finally, another really badly considered beer containment and transportation device that sets the bar for really bad engineering ideas in action. Ladies and gentlemen, we give you the "Beer Belly":


Beer Belly Truly, we have advanced as a culture. My father had to drink his way to an unsightly beer belly the old-fashioned way. Now you can buy your own, and apply liters of sloshing alcohol to your gut directly! Featuring everything that's wrong with the Beer Bra without even pretending there's an upside. Bonus points for the male model in the picture. "Yes, I'm an alcoholic just like you! I mean, whenever I'm not spending five hours a day in the gym, I'm definitely in - er, pubs, right?"


Happy St. Patrick's Day!

Jumat, 09 Maret 2012

Beer Taxes By State

How much tax will you pay on a can of beer?


The answer is: it depends. Specifically, it depends upon which U.S. state you might be in when you buy that 12-ounce container of 4.7% alcohol-by-volume beer that you'll be taking "off-premise" to consume. The good news is that the Tax Foundation has mapped it all out for you!


Tax Foundation: State Beer Excise Tax Rates

As we can see, both Alabama and Georgia are by far the most expensive places in the U.S. to buy and consume a beer "off-premise". Which perhaps explains why these two states stand out so much among their neighboring states when annual beer consumption is mapped out for each state (HT: Sloshspot):


Sloshdot: Beer Consumption per State, 2009

Looking over the map, it appears that state excise taxes for beer have quite a bit to do with how much beer is consumed within the states!

Kamis, 24 November 2011

Happy Thanksgiving!

We couldn't resist sharing the following image, stolen from here, which brings our love of food, math and Thanksgiving all together:


C/D = pi

Have a Happy Turkey Day!