Jumat, 09 Desember 2011

Scheduling the Next U.S. Recession

Thanks to the Fed's excursion into Zero Interest Rate Policy (aka "ZIRP"), we can't use our dedicated tool that reckons the odds of a recession up to a year in the future.


But we can do the next best thing and listen to what the stock market is trying to tell us:


S&P 500 Quarterly Dividends per Share, 2009-Q1 Through 2011-Q3, with Futures Through 2012-Q4, as of 8 December 2011

Here, we find that the private sector of the U.S. economy is set to slow down in a big way going into the second quarter of 2012, which we see as the decrease in that quarter's expected dividends per share.


Keep in mind the extremely slow growth of just once cent per share from the second to third quarters of 2011 directly coincided with what we've described as a microrecession in the United States, which we've since confirmed using international trade data.


But what does that mean for jobs? After all, as we've seen previously, the big job losses following the beginning of a recession often occur quite a bit after it has begun.


Fortunately, we have another tool we can use to predict how the U.S. unemployment rate will change, up to two years in the future! The relationship between inflation-adjusted motor gasoline prices and the unemployment rate in the U.S.!

U.S. Unemployment Rate and Real Motor Gasoline Prices (and Projections) Shifted Two Years Later, January 1978 through November 2011

Here, we've shifted the red curve indicating the level of real motor gasoline prices in the U.S. some two years into the future. Here, we see that the recently announced unemployment rate of 8.6% for the U.S. is right about exactly where the gas prices of two years ago would predict they would be.


(Technically, they had been higher than anticipated until the most recent employment situation report, but then, remember the U.S. went through that whole microrecession thing!)


Looking into the future, we see that the unemployment rate through 2012 is likely to fall into the range between 8.5% and 9.0%. But very early in 2013, it would seem set to skyrocket back up over the 10% mark, after beginning to rise sharply toward the end of 2012.


That won't be any microrecession. And now, you can't say you weren't warned about what now looks like is coming this way!


Elsewhere on the Web


Doug Short compares the track record of two leading economic indicators and notes that the two have diverged in recent months, with one signalling recession and the other chirping along merrily - only one can be right!...

Kamis, 08 Desember 2011

Your Maximum and Target Heart Rate

How many times per minute should your heart beat while you're exercising?


Age and Gender Data
Input Data Values
Your Age
Your Gender


Your Maximum and Target Heart Rates
Calculated Results Beats per Minute
Your Maximum Heart Rate
Your Target Heart Rate Range


NASA's G-Trainer


It used to be really easy to calculate what your maximum and target heart rate for working out should be - you just took your age, subtracted it from 220 and that gave you your maximum heart rate. You would then try to keep your heart rate between 50% to 80% of that number to get the best cardiac workout that medical professionals could recommend.


But then, while that math works for men, it turns out that math doesn't work for women!


Fortunately, a new math formula for finding the maximum and target heart rates for women has been developed: all a woman needs to do is to subtract 88% of their age from 206 to find their maximum heart rate number, then keep their pulse rate between 50% and 80% of that result while exercising!


Since that really isn't the kind of math that people can do in their heads, our latest tool is designed to take your head out of the picture, so you can focus on that workout of yours, regardless of whether you're a man or a woman!


Just enter the indicated data into the tool, and we'll tell you just how fast you need to get your blood pumping while you're working out on that new-fangled treadmill....


So there you go - now give us 20!


Image Credit: NASA's G-Trainer. Why, it's our tax dollars at work!

Rabu, 07 Desember 2011

Winter 2011 Edition: Who Owns the U.S. National Debt?

As of the end of the U.S. federal government's 2011 fiscal year on 30 September 2011, the United States' total public debt outstanding was recorded to be approximately $14.790 trillion. From the end of the U.S. government's Fiscal Year 2010, the amount of the U.S. national debt has increased by 9.1% in just one year, or $1.2 trillion.


The chart below provides a preliminary look at who the biggest holders of all the U.S. government's public debt outstanding were as of 30 September 2011:


Preliminary Major Holders of U.S. Government-Issued Debt as of 30 September 2011 (End of Fiscal Year 2011)

Comparing this new chart with ones we've previously featured, we've broken out the U.S. Federal Reserve's holdings from the U.S. Individuals and Institutions category, reflecting the Federal Reserve's massive purchases of U.S. Treasuries as part of its quantitative easing programs.


Overall, in the year from 30 September 2010 to 30 September 2011, the U.S. Federal Reserve increased its purchases of U.S. government-issued debt from $966 billion to $1,773 billion, an 83.5% year-over-year increase.


These figures only include the value of securities issued by the U.S. Treasury or other federal government agencies. It does not include mortgage-backed securities, such as those issued by government-supported enterprises such as the Federal National Mortgage Association (Fannie Mae) or the Federal Home Loan Mortgage Corporation (Freddie Mac).


Our look at who owned the largest shares of the U.S. national debt is only preliminary since the data for foreign nations will be revised at some time in 2012.


How Much Will Upcoming Revisions Change This Picture?


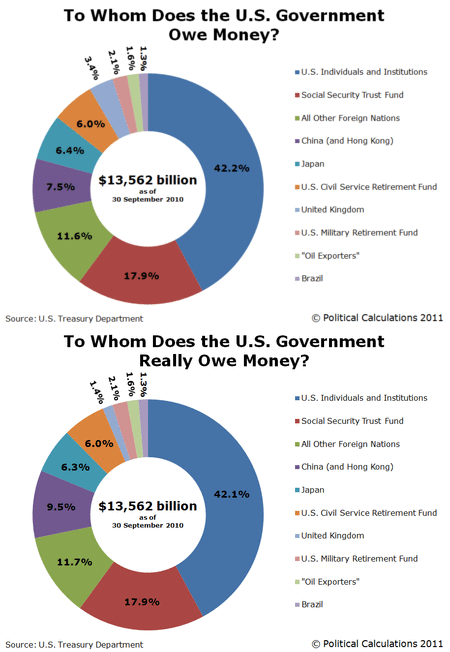
We've created an animated version of our two primary charts revealing the major holders of U.S. government issued debt through the end of Fiscal Year 2010, our original version and the updated version incorporating the U.S. Treasury's revised data, to help give an idea of how much the values and percentage shares presented in our new chart above might change when the data spanning Fiscal Year 2011 is revised:


Animated Chart: Major Holders of U.S. Government Issued Debt, Original vs Revised, 30 September 2010

Note that the biggest change is that the share of U.S. government-issued debt held by China increases at the expense of the originally reported level of U.S. Treasuries held in the U.K. We anticipate a similar change when the data is revised in 2012, although this year, Europe's ongoing debt crisis might be playing a role in inflating the U.K.'s reported share of U.S. Treasury securities as well.


Previously on Political Calculations


Who Owns the U.S. National Debt

To Whom Does the U.S. Government Really Owe Money?

Summer Update: To Whom Does the U.S. Really Owe Money

Data Sources:


Board of Governors of the Federal Reserve System. Monthly Report on Credit and Liquidity Programs and the Balance Sheet, October 2011. Table 1. Assets, liabilities, and capital of the Federal Reserve System.


Board of Governors of the Federal Reserve System. Monthly Report on Credit and Liquidity Programs and the Balance Sheet, October 2010. Table 1. Assets, liabilities, and capital of the Federal Reserve System.


U.S. Treasury Department. Major Foreign Holders of Treasury Securities. Accessed 6 December 2011.


U.S. Treasury Department. Monthly Statement of the Public Debt of the United States, September 30, 2011. Table III – Detail of Treasury Securities Outstanding, September 30, 2011.

Selasa, 06 Desember 2011

Can Increasing the Minimum Wage Boost GDP?

Does increasing the minimum wage increase GDP?


Bloggingstocks' Joseph Lazaro outlined the theory that it might back on 1 August 2009, shortly after the U.S. federal minimum wage reached its current level of $7.25 per hour (emphasis ours):


... the U.S. Federal Reserve will be monitoring prices and costs to see if the higher minimum wage is creating inflation havoc at a time when U.S. businesses least need another concern to deal with. Businesses have enough to worry about; and some are struggling just to maintain operations for another quarter or two -- the recession has been that damaging.


But the Fed will also be looking for signs of another side-effect, and this one is a positive one: a GDP boost. That's because millions of workers are going to get a raise that they otherwise would not have gotten, and that will increase their purchasing power.


The significance? Some of those increased-pay workers will choose to spend -- perhaps buying a washer or drier, making a down payment on a used car, or paying down a debt. It's quite possible -- although in these "frugal consumer" economic times no one is certain- - that the wage hike will increase U.S. GDP, serving as a small engine of growth as the U.S. economy inches back toward health.


It's an intriguing possibility isn't it? But has it worked out that way?


One way we can find out if boosting the federal minimum wage has boosted GDP is by examining the economic fortunes of the people most likely to be earning minimum wages in the United States: teenagers and young adults!


Together, individuals between the ages of 15 and 24 have consistently made up approximately one half of all minimum wage earners, so we should be able to use the personal income data the U.S. Census has collected and published for this age group for each year since 1994.
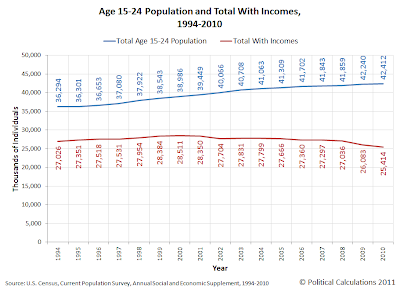


Age 15-24 Population and Total With Incomes, 1994-2010

First, let's consider the population of 15-24 year olds in the United States, and the number of those individuals counted as having income from 1994 through 2010.


Over this time, the federal minimum wage has increased from $4.25 per hour in 1994, to $4.75 in 1996 and then 50 $5.15 per hour in 1997, where it held level until 2007. Beginning in 2007, it was increased by 70 cents per hour once a year up until it reached its current level of $7.25 per hour in 2009.


What we see however is that the number of teens and young adults with incomes has fallen over time. Our next chart shows the percentage of Americans between the ages of 15 and 24 who were counted as having income in the U.S. Census' Current Population Survey for each year from 1994 through 2010.
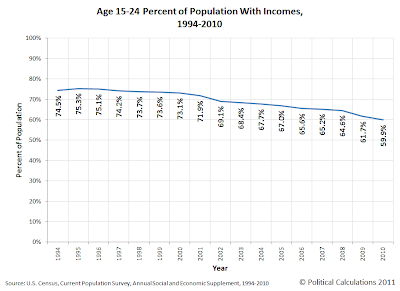


Age 15-24 Percent of Population With Incomes, 1994-2010

In this chart, we find that the percentage of teens and young adults who had incomes peaked in 1995, with 75.3% of the entire Age 15-24 population counted as having earned income in that year, which has since fallen to 59.9% as of 2010.


So far, both these charts indicate that the number of teens and young adults in the U.S. workforce has fallen from 1995 through 2010 - these charts don't tell us anything about how teens and young adults might have benefited from higher pay obtained through a rising minimum wage over time!


For that, we'll dig deeper in the U.S. Census' data and extract the data for the aggregate amount of income earned by individuals Age 15-24. Since one way of measuring the U.S. Gross Domestic Product is to add up all the income earned by people in the United States, we can use the Census' estimate of the aggregate income earned by U.S. teens and young adults to represent their contribution to the U.S.' GDP.


The easiest way to do that is to compare the amount of income earned by all U.S. teens and young adults in 1995, when the percent share of teens in the U.S. workforce peaked with the total amount of income earned by all U.S. teens and young adults in 2010, the most recent year for which we have data.


Nominal and Real Aggregate Income for Individuals Age 15-24, 1995 and 2010

Coincidentally, selecting these particular years for comparision works especially well for our purposes, since it spans the increases in the U.S. minimum wage from $4.25 per hour to $7.25 per hour, with 1995 being one year before the first minimum wage increase in our period of interest occurred, and 2010 being one year after the most recent increase in the U.S. minimum wage took place.


We'll also adjust the numbers to account for the effect of inflation, using an animated chart to show the results.


What we find in examining this chart is that for the 15 year span from 1995 to 2010, the nominal aggregate income of U.S. teens and young adults increased by 14.75%, from roughly $302.9 billion to $347.5 billion.


But most remarkably, in terms of constant 2010 U.S. dollars, the aggregate income of U.S. teens and young adults fell by 0.56% from $349.5 billion in 1995 to $347.5 billion in 2010. For all practical purposes, despite a 70.6% increase in the nominal value of the U.S. federal minimum wage from $4.25 to $7.25 (a 21.8% increase in real terms), the total amount of income collectively earned by the predominant earners of the U.S. minimum wage in the United States is unchanged.


Total Money Income Distribution for Individuals Age 15-24, 1995 and 2010

Let's take a step backwards and consider the nominal income distribution of teens and young adults in both 1995 and 2010 in nominal terms.


Our next animated chart shows how many thousands of Age 15-24 individuals the U.S. Census counted within each $2,500 increment of total money income in both 1995 and 2010.


Here, we find that the distribution of income has shifted primarily at the lower end of the income spectrum. Our final chart quantifies the changes for each of the U.S. Census' measured income increments.


Here, we note that an individual earning the U.S. federal minimum wage of $7.25 per hour in 2010 who works full time (2,080 hours per year = 8 hours a day, 5 days per week, 52 weeks per year), would earn $15,080 in a year. That puts all the income affected by increases in the U.S. federal minimum wage over time below this level.


Change in Number of Age 15-24 Total Money Income Earners from 1995 through 2010

What we find is that this income range at the lowest end of the income spectrum for Americans between the ages of 15 and 24 is the only income range where there have been reductions in the number of individuals with incomes between 1995 and 2010.


We also find that the number of individuals with incomes below $15,000 has fallen by 5,045,000 from 1995 to 2010. Meanwhile, we find that the number of Age 15-24 individuals with incomes over $15,000, which would be considered to be largely unaffected by increases in the U.S. federal minimum wage over time, has increased by 3,105,000.


Overall, there are 1,940,000 fewer individuals between the ages of 15 and 24 with incomes in 2010 than in 1995.


Consequently, we find that increasing the federal minimum wage has failed to increase GDP over time. Worse, we find that increasing the federal minimum wage has actually increased income inequality within the Age 15-24 population from 1995 through 2010, as the same aggregate income, when adjusted for inflation, is effectively being spread among nearly two million fewer people.


Returning to Joseph Lazzaro's thoughts on the topic:


... if the Fed and other organizations can verify that the minimum wage increase has boosted GDP without a loss of jobs, or inflation, Congress may to consider another decision in the quarters ahead: a decision to raise the federal minimum wage again, this time to $8.25 per hour.


In our view, the only reason the U.S. Congress would choose to increase the federal minimum wage again would be to ensure the onset of a new recession.


This concludes our annual anniversary post, where we celebrate the biggest ideas we've developed during the past year! This year's anniversary post was a bit unique in that it combines two of the areas in which we've made a mark (or left one!): the real impact of minimum wages on the U.S. teen population and the real nature of income inequality in the United States.


As for the biggest ideas we've developed in previous years, here's the list:


  • 2005: A Year's Worth of Tools - we celebrated our first anniversary by listing all the tools we created in our first year. There were just 48 back then. Today, there are over 259....

  • 2006: The S&P 500 At Your Fingertips - the most popular tool we've ever created, allowing users to calculate the rate of return for investments in the S&P 500, both with and without the effects of inflation, and with and without the reinvestment of dividends, between any two months since January 1871.

  • 2007: The Sun, In the Center - we identify the primary driver of stock prices and describe a whole new way to visualize where they're going (especially in periods of order!)

  • 2008: Acceleration, Amplification and Shifting Time - we apply elements of chaos theory to describe and predict how stock prices will change, even in periods of disorder.

  • 2009: The Trigger Point for Taxes - we work out both when, and by how much, U.S. politicians are likely to change the top U.S. income tax rate.

  • 2010: The Zero Deficit Line - a whole new way to find out how much federal government spending Americans can really afford!


Thank you for joining us for our anniversary! We appreciate that there are a lot of ways you can choose to spend your time, and we greatly appreciate your willingness to share so much of it with us over the past year.

Senin, 05 Desember 2011

A Four Year Milestone for U.S. Jobs

Four years ago, the number of employed Americans peaked at 146,584,000 in November 2007, just ahead of the U.S. economy itself peaking in December 2007, which marked the starting point for the nation's most recent economic recession.


Through November 2011, four years later, the number of employed Americans has fallen to 140,480,000. Just over six million fewer Americans are working today than were four years ago.


Change in Number of Employed by Age Group Since Total Employment Peak Reached in November 2007 Through November 2011

Overall, the jobs situation in November 2011 brightened for most Americans from October 2011, especially for those Age 25 and older, whose numbers in the U.S. workforce grew by 405,000 during the month.


Young adults however were on the losing side of the employment picture however, as 145,000 fewer individuals between the ages of 20 and 24 were counted as being employed than were in October 2011. That's disappointing because young adults had been seeing the largest gains in the number of employed in each month since July 2011, at least, until now.


Meanwhile, the employment situation of American teens continued to improve very slowly, as only 18,000 additional individuals between the ages of 16 and 19 were counted as having jobs in November 2011.


Today, the jobs lost by teens account for nearly 1 in 4 of all jobs lost since the United States entered into recession in December 2007. That's remarkable because teens represented just 3.1% of the entire U.S. workforce in November 2011. Four years ago, teens made up just 4.0% of the 6,004,000 member larger U.S. workforce.


Continuing to break down the data, young adults today represent 9.4% of the U.S. workforce, while accounting for 13.1% of the total number of jobs lost in the U.S. economy since November 2007.


Adults Age 25 or older make up the remaining 87.5% of today's U.S. workforce. Through November 2011, these individuals account for 62.0% of all the jobs that have been lost in the last four years.

Jumat, 02 Desember 2011

Only in Washington

If you live in the state of Washington, and you would like to do "work that matters", the State of Washington might have just the right job for you!


The inside joke here is that prior to the passage of Initiative 1183 on 8 November 2011, only the State of Washington could operate liquor stores. As a result, all the employees of the state's liquor store outlets were really employees of the state government. Because of the initiative's passage, the state is being forced by its voters to get out of the liquor business.


But apparently, the State of Washington still feels that its liquor store jobs are doing "work that matters"! (We agree, but we'll still drink to the privatization of liquor sales in Washington!...)


HT: Stefan Sharkansky.

Kamis, 01 Desember 2011

New Jobless Claims: Still On Track

Today's news that the number of initial claims for unemployment insurance benefits being filed for the week ending 26 November 2011 ticked back up over the 400,000 mark is right on track with the prediction we published over a month ago.


Here's that prediction:


... since that slowly downward trending line is currently projected to stay above the 400,000 level through the end of 2011, we can therefore expect that there is over a 50% probability that the number of new, seasonally adjusted initial unemployment claims will be above the 400,000 mark through the end of the year.


In fact, what we can expect as we go forward in time is that we'll see an increasing number of times in the weeks ahead where the number of new jobless benefit claim filings will fall below the 400,000 mark, as the number of layoffs from U.S. employers each week continues to decline gradually.


Lo and behold, that's pretty much exactly what has happened so far in the time between 21 October 2011 and today, as shown in our chart below, which adjusts the trend line slightly:


Residual Distribution for Seasonally-Adjusted Initial Unemployment Insurance Claims, 26 March 2011 - 26 November 2011

For the six most recent observations of the number of new jobless claims, which cover the period of time since we made our prediction, three have been at or above the 400,000 mark, while three have been under.


We also see that the mean trend line has shifted to be slightly steeper, which suggests that the number of initial unemployment insurance claim filings each week will be more likely to fall under the 400,000 mark in the weeks ahead.


Meanwhile, Bloomberg reports that the uptick in new jobless claims is "unexpected":


Jobless claims climbed by 6,000 to 402,000 in the week ended Nov. 26 that included the Thanksgiving holiday, Labor Department figures showed today in Washington. The median forecast of 43 economists in a Bloomberg News survey called for a drop to 390,000. The number of people on unemployment benefit rolls and those getting extended payments increased.


Whoops! There's 43 economists whose forecasting ability is now in doubt, which is a shame because the number of new jobless claims filed each week is perhaps the easiest of all economic data to forecast while its basic trend is intact!


And at present, it appears that the current trend for weekly new jobless claims remains well in force.